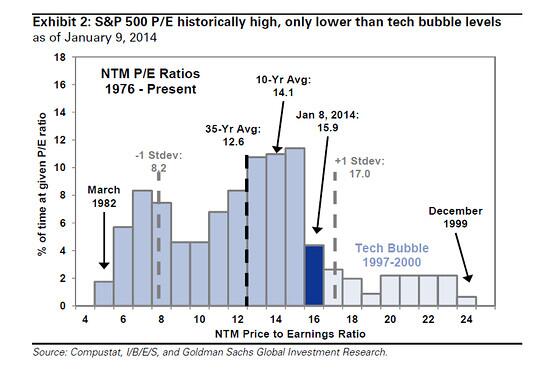
An S&P 500 P/E chart made the rounds a few days ago following a note from Goldman Sachs’ David Kostin’s observing the S&P 500’s (SPX) valuation is “lofty by almost any measure”. Here it is:
Following the long-revered custom when broad valuation metrics enter extreme territory (high and low), this note and chart drop into a context of steady debate featuring all the questions you’ve come to expect when P/E ratios are invoked:
- Are equities overstretched here?
- If so, which measure says so, and why should it be relied upon as coincident indicator (and predictor) when there are other equally estimable measures saying stocks are fairly valued?
- Tops don’t always coincide with elevated historical P/Es; so do these measures even matter?
- If yes, these measures are abysmal timing tools: so what other factors do we incorporate in our analysis, and what deference if any do we give to a “historically high” P/E (or any other single metric, for that matter)?
It’s a timeworn discussion that won’t be settled now; or in the wake of the next bear market. Which is alright: far more interesting is the secondary observation the chart makes. But first, revisit the chart title:
S&P 500 P/E historically high, only lower than tech bubble levels
The subject (“SPX 500 P/E historically high”) is straightforward enough; but the predicate tacked on to it (“only lower than tech bubble levels”) makes a much more valuable observation because it exactly captures the cognitive tone of the current market.
To describe the S&P 500’s valuation today, we are confined by it’s “loftiness” to a solitary point of reference: 1997-2000. Perhaps we can all take comfort that the current reading (15.9) is beneath (far beneath 1999) the tech bubble. But, this often-made contrast misses the all-important sub-text: the S&P 500’s NTM P/E is so high by historical standards that the biggest valuation bubble in living memory is our baseline for comparison.
We can confidently assert “look at the Dot-Com Bubble: this is nothing like it!” with an array of anecdotes and facts (technical, fundamental, sentimental) firmly on our side; but that our only valid comparison is a genuinely epic mania and speculative bubble for the history books is a disconcerting statement about a) how historically extended stocks are, and b) how dangerously acclimated to outliers we are at risk of becoming.
Several cognitive foibles that we possess help this along.
We’re constantly looking at 1999 (and 2008) not only because it stands tall statistically, but because the madness that marked it’s end-run and the twin desolation of late 2000 to 2002 make them emotionally salient points in the collective market’s memory.
As a result, we’re beset (usually helped, occasionally harmed) by the availability heuristic: have a tendency to access these events and overestimate the likelihood of their repetition. The tech bubble P/E ratios, for example, aren’t just cold and lifeless statistics: they still hold an emotional charge redolent with the psychological ecstasy of the bubble and shared trauma of the bust. Like I wrote yesterday, market bubbles cast a very long shadow.
Secondly, our appraisal of the S&P’s valuation here has a lot to do with something called base rate neglect. This is a lesser-discussed cognitive bias in behavioral finance that describes our tendency, given the choice, to focus on information that is specific to a certain event while ignoring baseline information that is related by more vague or general.
The S&P 500’s 35-year NTM P/E is 12.6, while today’s is 15.9, almost 1 standard deviation above the mean. However, given the outlier figures posted in the short market passage that was the tech bubble, we are inclined instead to make this our point of reference. A comparison of that era’s statistics with the present make this a sensible thing to do; but for reasons we are reviewing it is not sensible to make them our baseline. However, in an environment of at all-time highs, low volatility and token pullbacks, that is exactly what is happening. Setting aside a 35-year average suggesting stocks are overvalued in favor of pointing a metric’s present modesty to a classic valuation bubble is the mind of the market saying “this time is different”.
Another lesser-known but insightful bias befalling us here is the contrast effect.
To illustrate, consider the below image by staring at the dot in the middle of the orange circle. After a few seconds, immediately look at the dot in the circle just below it. You will notice that the circle to its right appears to have a different color, though both circles on the bottom are exactly the same. Now simply look at the bottom row: you’ll notice both circles for what they are: identical.
This phenomenon is referred to as successive contrast and is a trick of your peripheral vision: it occurs when perception of your current visual stimulus (i.e. what you’re looking at now) is uniquely varied or altered by observation of a previous stimulus. More broadly, as Wikipedia puts it, it is:
The enhancement or diminishment, relative to normal, of perception, cognition and related performance as a result of immediately previous or simultaneous exposure to a stimulus of lesser or greater value in the same dimension.
The chart up top is not unlike these circles. Viewing tech bubble statistics, recalling tech bubble anecdotes, looking at tech bubble-era price charts, we find ourselves saying the present is not the same – we’re not as mad, and as a result the outlook must not be dire. That may be right; but by making the rise-to-fall of that catastrophe the previous, basal stimulus, it alters the market we observe today: the current stimulus.
It’s impossible to not have a “previous stimulus”: we all come from somewhere formative, and have looked, heard, smelled, tasted and touched things that bewitched or repulsed us unlike all “stimuli” before and after. These elements define our context and help us understand what we’re experiencing and witnessing now.
But no matter how vivid or outlying that set of stimuli, there’s a body of countless others that we can’t risk crowding out, because they are the sole, sound point of reference we have. If we attempt to do that now, it’s difficult to rationally conclude stocks are not overvalued. The lessons of past bubbles are many: how to subvert their tyranny of our memory is one we have yet to effectively learn.
Twitter: @andrewunknown and @seeitmarket
Author holds no exposure to instruments mentioned at the time of publication. Commentary provided is for educational purposes only and in no way constitutes trading or investment advice.
Any opinions expressed herein are solely those of the author, and do not in any way represent the views or opinions of any other person or entity.


