Equity markets appear to have largely gotten over the China issues, inflation and slowing economic data … for now.
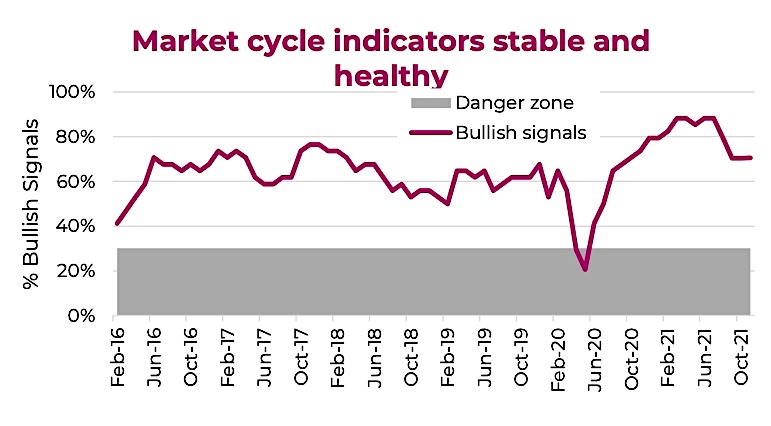
Once again it seems that good news on the earnings front trumps any other macro concerns. Even with some companies showing the margin strain from higher costs due to inflation or labor, the overall results appear ‘good enough’ for the market and back the on-going strength in this market cycle and our composite of market cycle indicators (above).
And once again we have the S&P 500 making a fresh new monthly high, a streak that goes back 12 months now. The record since the inception of the S&P 500 in the 1920s, is 15 months in a row with new fresh highs, set recently in 2014. Impressive, as are other equity markets with most sitting on 20% gains for the year. A great time to be an investor.
Based on market performance in October, clearly we should have been more bullish. Sorry. While the market appears resilient to headwinds, they continue to grow stronger; we highlight two that are front and center in our thinking and feed into the strength of this market cycle.
Earnings – Corporations have again proven adept at managing a very challenging and fluid environment with demand volatility and supply issues, but the pressures are building (read on for a look at inflation). And even this earnings season, which is good, shows slowing sales and earnings growth. Margin and cost pressure is coming soon to a company near you.
The Punch Bowl – Remember the old adage that the bull market would continue until the central banks took the punch bowl away? Oh how big the bowl has become – in the trillions. Take note that while the Fed is just starting to taper likely next month, other central banks have been starting to remove the punch bowl. Among the 25 central banks we monitor, 9 have raised short-term rates during the past 3 months. Turkey was the only one that eased, but let’s just chalk that up to a unique situation. Pretty much all the hikes are in developing nations, but the developed world looks to be not far behind. The Fed will start tapering likely next month. The Bank of Canada abruptly ended its quantitative policy, triggering a sudden flattening of the curve.
The once-uniform policy stance of more, more, more is starting to fragment. For now, the heavyweights, Fed and ECB, have not budged, but policy outlook is becoming more challenging for asset prices.
The good news is, behind these headwinds is a global economy that continues to improve. The current data being released is showing the lagged impact of the delta variant, which should be less noticeable in the data in coming months. And of course the supply chain issues. For instance, the U.S. economy grew at only 2.0% in Q3 but if you add back in the drag from the auto sector, you would have had 4.3% growth. Inventories declined, which should help future quarters data.
There is no denying, the market cycle remains healthy. The market cycle indicators framework is a multi-factor, multi-discipline approach that attempts to answer the big question: is a recession on the horizon? The framework uses a basket of economic, fundamental and yield/credit indicators that have historically been good predictors of recessions. Complicating matters, every recession is different and as a result some indicators work in some cycles and not in others.
There is no one magic indicator. By combining a diversified basket of indicators, we believe this offers investors a non- emotional lens to gauge if recession risks are elevated or dormant to help guide asset allocation decisions in calm markets and during periods of market weakness.
Market Cycle – we would best characterize the current readings as healthy and stable. The percentage of bullish signals has remained at about 70% for the past couple months, after coming down from unsustainable highs. Even if they were to come down a bit further, we would not likely be sounding any alarms.
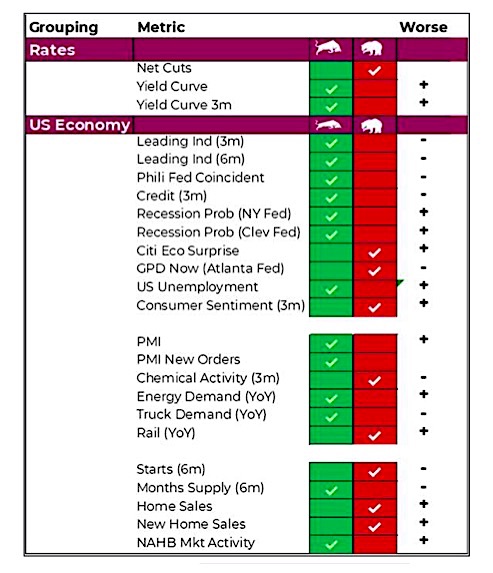
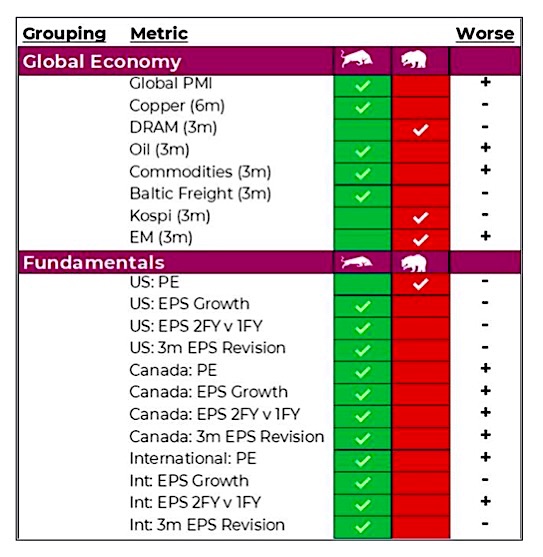
No real movement on the rate side as a forward indicator. Clearly if we included the Canadian yield curve, which flattened substantially last month, this would be a negative. But in the big scheme of things, our yield curve just doesn’t matter enough for the global market cycle. U.S. economic data was down one signal, as GDPNow turned bearish. This economic measure is more focused on high frequency data to provide a more timely indication. Not surprising, the actual GDP data supports the softening. To counter this, the global economy saw oil price changes turn from bearish to bullish. All in, we are roughly where we were last month.
Again, this framework does not help indicate if we are at heightened risk of a market pullback or correction. We do believe that risk is elevated. The market cycle is designed to help provide a signal if we are truly heading into a bear market / recession combination. At the moment, clearly not, which means any pullback is more likely a buying opportunity.
Source: Charts are sourced to Bloomberg L.P., Purpose Investments Inc., and Richardson Wealth unless otherwise noted.
Twitter: @ConnectedWealth
Any opinions expressed herein are solely those of the authors, and do not in any way represent the views or opinions of any other person or entity.


 Testing Important Price Support")
")
