An August 2016 analysis outlined a long-term bullish signal for stocks that has occurred only ten other times in the last thirty-five years.
If we fast-forward to December 2017, is market breadth/volume aligning with or contradicting bullish data we have in hand?
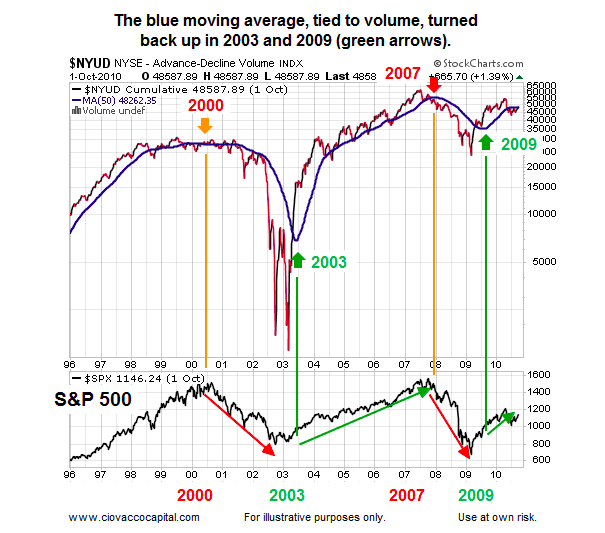
The chart below shows up/down volume (1996-2010) for the NYSE Composite Stock Index (INDEXNYSEGIS:NYA), along with its 50-week moving average (thick blue line).
Notice how all-things-being equal, the probability of bad things happening increases when the 50-week moving average is flat or negative (see orange and red arrows below). Conversely, the probability of good things happening increases when the 50-week moving average turns back up in a bullish manner (see green arrows below).
The S&P 500 (INDEXSP:.INX) is shown at the bottom of the image below for reference purposes.
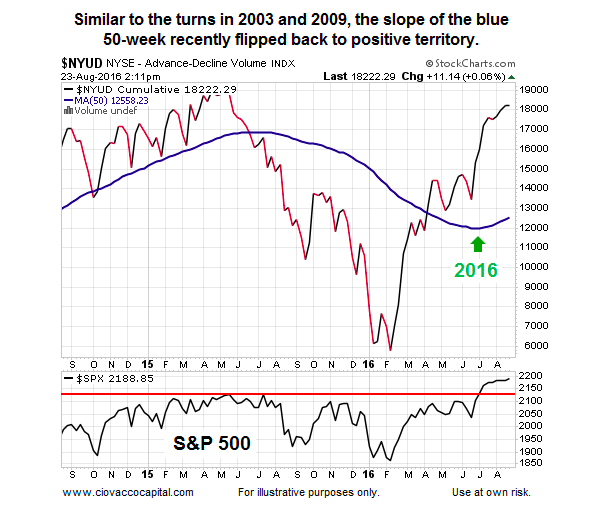
Trend Flipped In Favor Of The Bulls In 2016
In simplified terms, volume patterns shifted from favoring declining issues in early 2016 to favoring rising issues in the second half of 2016 (see green arrow below).
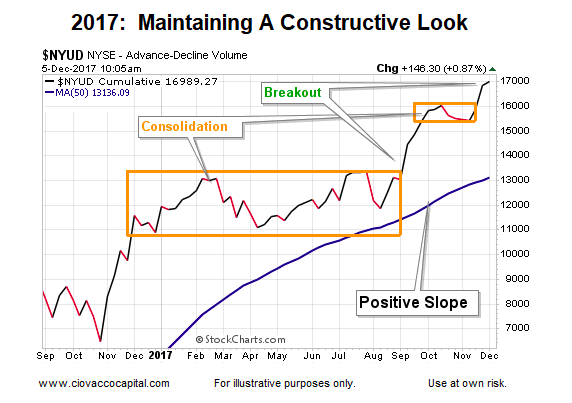
Is The Bullish Bias Still In Play?
As shown in the chart below, the slope of the 50-week moving average still favors good things happening over bad things happening looking out weeks, months, and years. The chart below is dated December 5, 2017.
What Can We Learn From Eight Monthly Charts?
This week’s stock market video looks at numerous monthly charts to see if they align with or contradict the bullish case. The video covers facts rather than opinions or fears of what may or may not happen in the future. The video covers the following:
- S&P 500 vs. Bonds
- Financials vs. S&P 500
- Tech Stocks
- Tech Stocks vs. Bonds
- Industrial Stocks vs. Bonds
- NYSE Composite
- Homebuilders
- Small Caps vs. S&P 500
A Foolproof Signal?
Since there is no such thing as a foolproof indicator or signal in the financial markets, the recent bullish shift in up/down volume assists us with probabilities. As long as the slope of the 50-week remains positive, the odds of good things happening will be higher.
Long-Term Means Long-Term
The facts covered above relate to longer-term outcomes, meaning weeks, months, and years. For this data to be used effectively, we must have realistic expectations about normal volatility within the context of a rising trend.
Twitter: @CiovaccoCapital
The author or his clients may hold positions in mentioned securities at the time of publication. Any opinions expressed herein are solely those of the author, and do not in any way represent the views or opinions of any other person or entity.


