With the December round of PMI data recently released, it’s a good time to take a look at some of the key macro and market metrics for developed vs emerging markets. Aside from the timeliness aspect, there are some very interesting trends underway across both Emerging Markets (EM) and Developed Markets (DM), and particularly on the relativities.
Before getting into it, I know some of you will be thinking “hey, EM is a worn out term, it’s too heterogeneous and wrong to lump them all together” – and while I get this viewpoint, I’ve previously highlighted a couple of metrics that delineate EM from DM and the distinction still seems fair on this analysis.
Back to the topic, the key takeaways (as outlined in the charts below), are:
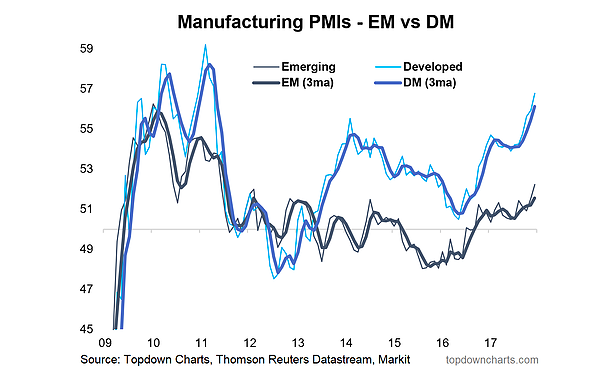
The Emerging Markets composite PMI is picking up pace (broke out to a 6 and a half year high), yet there is still considerable upside should a catch-up process get underway.
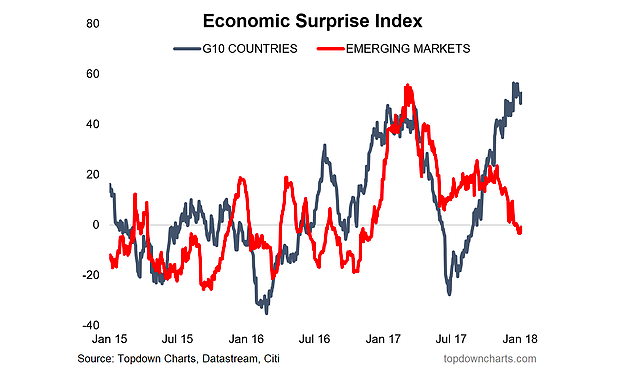
The Emerging Markets economic surprise index has reset back to neutral, while Developed Markets is at multi-year highs… the implication being that there is more scope for upside in EM vs DM.
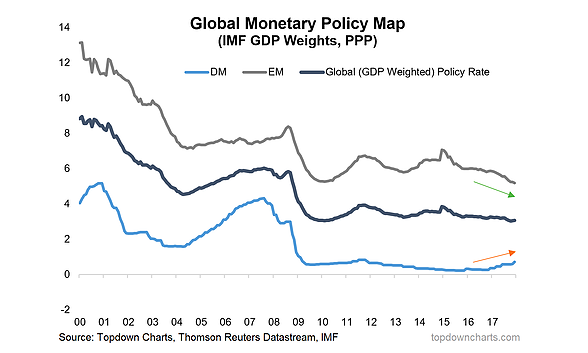
EM aggregate monetary policy rates have been on a gradual easing path vs tightening in developed economies; at the margin this is more favorable for EM on a cyclical view.
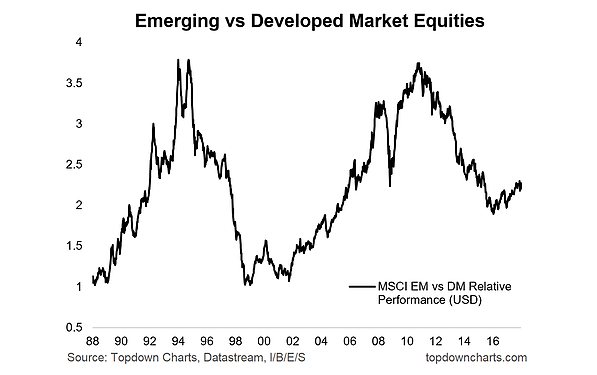
EM equity relative performance appears to have put in a long-cycle low, and we could be on the cusp of a potential multi-year cycle of EM outperformance. The tactical view (cycle + policy) aligns with this.
1. Manufacturing Surveys: A very interesting dynamic is underway in both Emerging Markets (EM) and Developed Markets (DM), with the final quarter of 2017 seeing significant acceleration on both fronts, but note the scope for catch-up (and upside) in EM is arguably much greater. Also worth noting is the breakout in the EM composite to the highest point since mid-2011… did somebody say melt-up?
2. Economic Surprise: Interestingly enough, while the Emerging Markets composite PMI has been improving lately, the data in general for emerging markets has been basically coming in right on expectations if not disappointing somewhat (China was key in this initially, and subsequently LatAm). This turn down in the EM ESI contrasts with major positive surprises in developed economies (G10).
Here’s a question for you: Which one has the most scope for upside?
3. Monetary Policy: Arguably one of the reasons for the relaxed risk pricing in Emerging Markets has been the renewed cycle of monetary policy easing across emerging markets. This is in contrast to a gradual tightening in developed economies (in aggregate, on policy interest rates alone). At a high level, the rate of change here in monetary policy interest rates favors EM at the margin.
4. Equities: Finally, on equity markets (where the rubber hits the road for investors, so to say), there is a curious tendency for emerging market vs developed market equities relative performance to undergo very long cycles. The distance from the 88 bottom to the early 2000’s bottom was about 12-14 years. which is about the same distance in time as the 2016 low is from the early 2000’s bottom. As global equities break higher, emerging markets could well be key. But at least on an EM equity relative performance basis there is certainly room to argue that a long-cycle bottom is in and the macro (cycle/policy) backdrop supports this view on a tactical basis.
Thanks for reading.
Twitter: @Callum_Thomas
Any opinions expressed herein are solely those of the author, and do not in any way represent the views or opinions of any other person or entity.
: Cup (and Maybe Handle) Watch")
 Reaches Important Price Support")
