June 7 S&P 500 futures outlook – Breakout formations continue to hold, and momentum is now holding steady. Overall, patterns still look bullish, with the best behavior of removing at targets above and not waiting for expansions higher. Support level bounces remain key areas to add to the long side. The new levels, 2116.5 to 2118.5, are initial resistance points today. If the buyers can come in to defend breakout action, we could see a return to upside targets, a run higher would be likely. Support today looks like 2109 – 2104.5, with more selling activity below the fight to defend 2108.
See today’s economic calendar with a rundown of releases.
THE RANGE OF TUESDAY’S MOTION
E-mini S&P 500 Futures (ES_F)
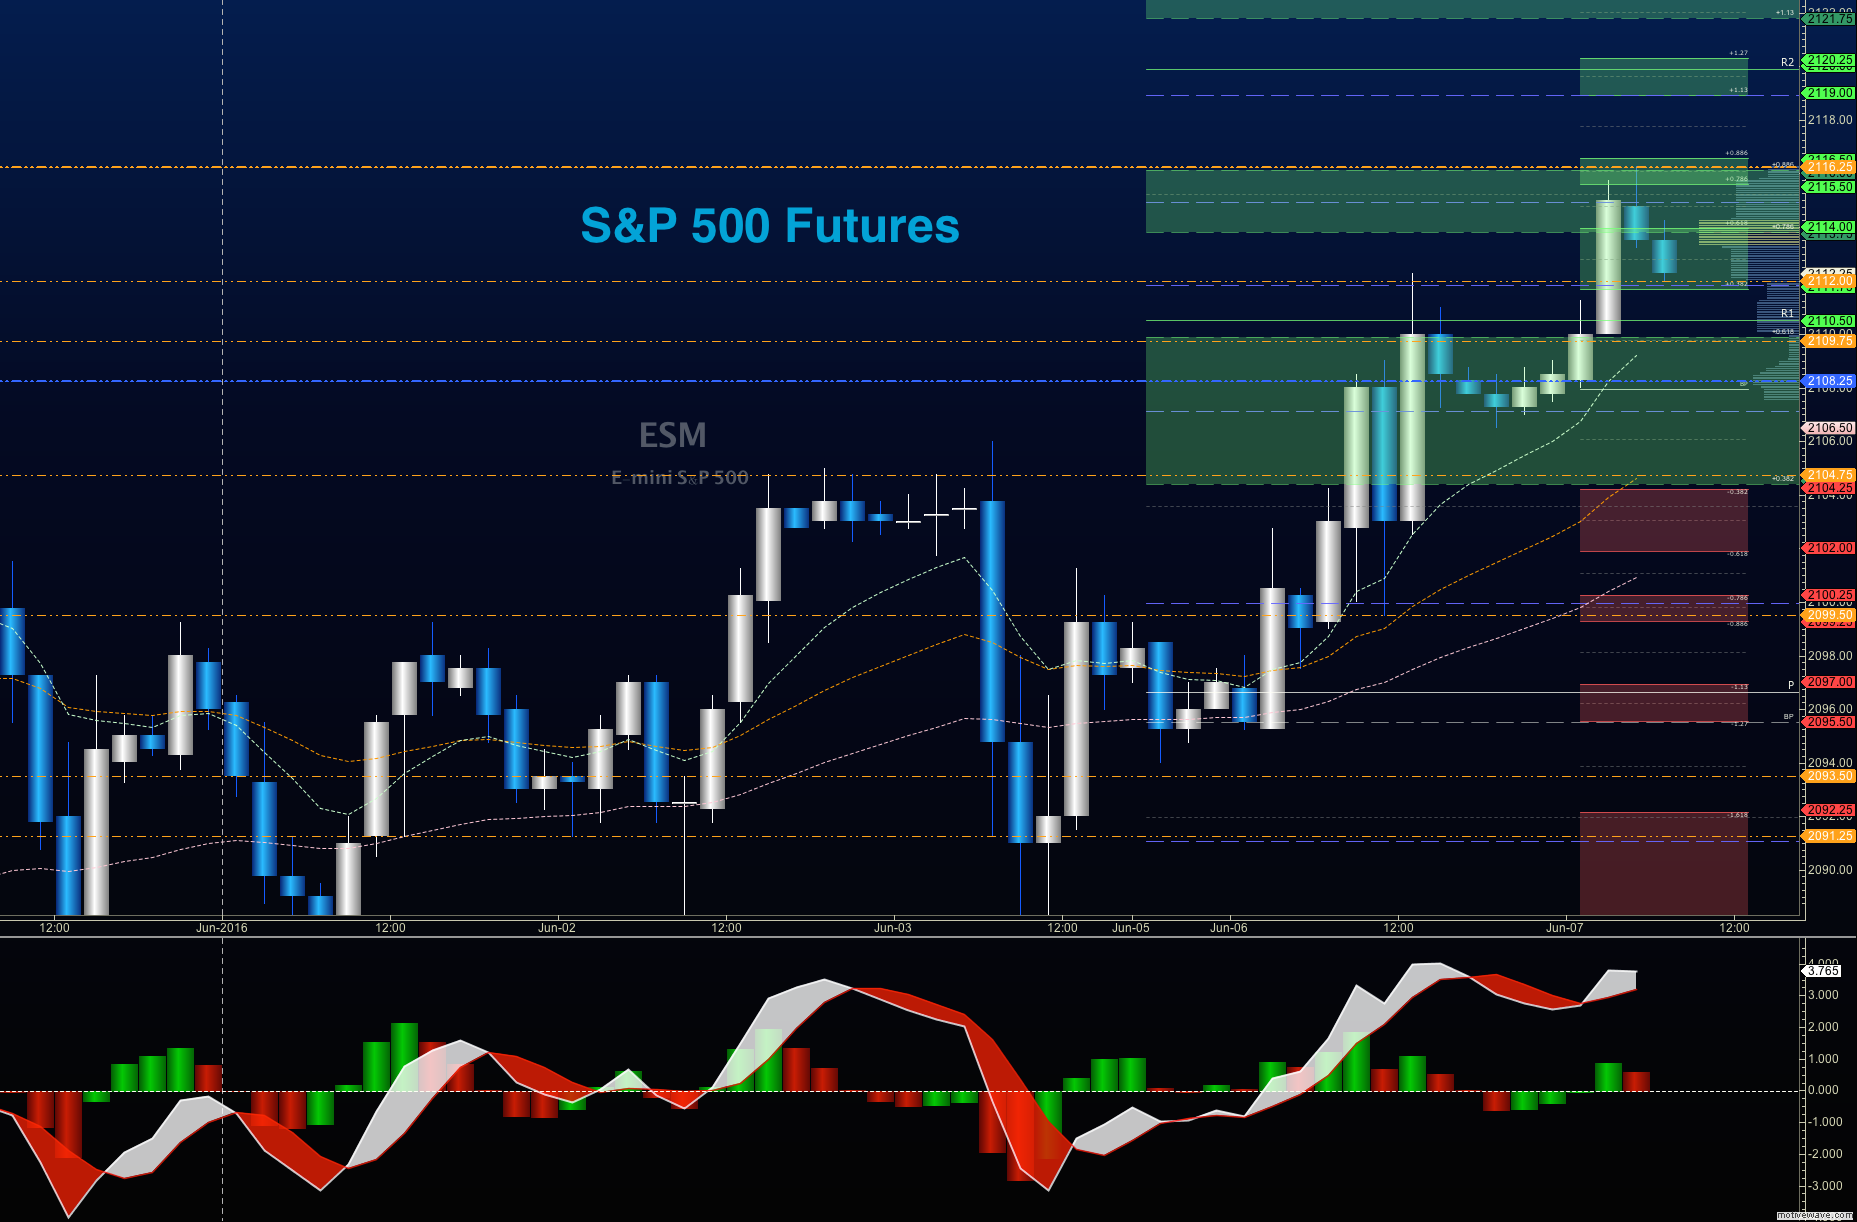
June 7 S&P 500 Futures Outlook – Rejecting early morning highs – tests of higher support ahead.
Upside trades on S&P 500 futures – Favorable setups sit on the positive retest of 2112.5, or a positive retest of 2109 with positive momentum. I use the 30min to 1hr chart for the breach and retest mechanic. Targets from 2109 are 2111, 2112.5, 2115.75, 2116.5, and perhaps 2118.25, and 2120.25, if the shift of balance remains with the buyers. Seeing quite a bit of divergent momentum. I will be watching for failed bounces.
Downside trades on S&P 500 futures – Favorable setups sit below the failed retest of 2115.5 or at the failed retest of 2108 with negative divergence. It is important to watch for higher lows to develop with the 2115.5 entry, if the strength of motion holds with the buyers. Retracement into lower levels from 2115.5 gives us the targets 2112.5, 2109.6, 2108, 2106, 2104.75, 2101.5, 2099.5, 2096.25, 2094.25, 2092.5, 2090.5, and perhaps back to 2082.5.
Have a look at the Fibonacci levels marked in the blog for more targets.
Nasdaq Futures
Outlook for June 7 – The NQ_F expanded into upside targets, but has begun to fade. Significant overhead supply continues to sit between 4538 and 4564. Weak momentum continues, but remains in positive territory. Bearish action will be amplified below the failed retest of 4524, and the failure to recapture 4531 will leave us vulnerable to sellers taking control.
Upside trades on Nasdaq futures – Favorable setups sit on the positive retest of 4530.5, or a positive retest of 4524.5 with positive momentum. I use the 30min to 1hr chart for the breach and retest mechanic. Watch for the lower high to develop, and sellers to force the chart down, if sellers take hold near the 4530.5 test from below. Targets from 4524.5 are 4530.5, 4535.5, 4544.75, 4550.75, 4554.5, and 4560.25. Range expansions above here should fail under the negative divergence, but could stretch into 4564-4578.
Downside trades on Nasdaq futures – Favorable setups sit below the failed retest of 4530 or at the failed retest of 4541 with negative divergence. Retracement into lower levels from 4541 gives us the targets 4535.5, 4531.5, 4528.75, 4525.25, 4520.75, 4516.5, 4512.5, 4508.5, 4502.5, 4497.5, 4479.5, 4472.25, 4464.75, 4451.25, and perhaps 4434.5 – but those deep levels only come about if we have a real shift of momentum.
Oil
Outlook for crude oil futures for June 7 – Look for the API report after the close today. The chart of crude oil expanded outside its wedge formation to sit over 50 this morning, but momentum is a bit damp. There are definitely a group of buyers looking to keep the chart over 50. Bullish action is still slightly more probable, so pullbacks ought to be bought, as they were yesterday. Buying breakouts will be problematic, unless the trader is trading to initial targets and removing profits.
The trading range for crude oil futures suggests support action near 47.7, and resistance behavior near 50.74.
Upside trades on crude oil futures can be staged on the breach of 50.22, or at a pullback into 49.64. If the chart dips sharply into 49.27 again, buyers will lurk there also – this is due to the formation of price action in play. Watch carefully for resistance ahead at 49.93 near the entry of 49.64. I often use the 30min to 1hr chart for the breach and retest mechanic. Targets from 49.27 are 49.42, 49.57, 49.74, 49.93, 50.2, 50.37, 50.71, 50.92, and if we really expand 51.01 and 51.25 to 51.41. Range expansion could occur here if buyers exercise real pressure, or if stops start getting triggered. Price is still very likely to fail on any big range expansion, especially if it is due to squeezing action on the stops.
Downside trades on crude oil futures can be staged on the failed retest of 49.93, or at the failed retest of 50.2 with negative divergence. Again, we can also look for exhaustion moves north, but with eyes on higher support coming in to push the chart upward. These setups give us targets from 50.2 into 49.93, 49.72, 49.4, 49.27, 49.04, 49.98, 48.86, 48.7, 48.49, 48.27, 47.97, and perhaps 47.68 to 47.24.
If you’re interested in the live trading room, it is now primarily stock market futures content, though we do track heavily traded stocks and their likely daily trajectories as well – we begin at 9am with a morning report and likely chart movements along with trade setups for the day.
As long as the trader keeps himself aware of support and resistance levels, risk can be very adequately managed to play in either direction as bottom picking remains a behavior pattern that is developing with value buyers and speculative traders.
Twitter: @AnneMarieTrades
The author trades stock market futures every day and may have a position in mentioned securities at the time of publication. Any opinions expressed herein are solely those of the author, and do not in any way represent the views or opinions of any other person or entity.


