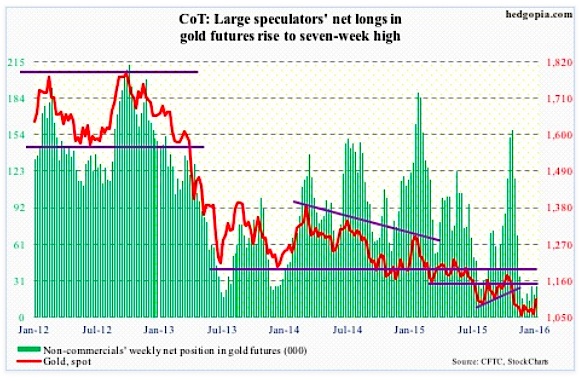
Gold: The metal is attracting some bids, probably thanks to the recent market mayhem… and technicals.
Support at $1,080/ounce was lost in the middle of November, with spot gold moving sideways since.
The rally in gold prices this week not only helped the metal recapture the afore-mentioned price point but also complete a 10/20 crossover (daily average). Gold bugs have been able to use this near-term momentum to their advantage. Gold is above its 50-day moving average, and weekly momentum indicators are swinging higher.
After having substantially cut back net longs since October last year, non-commercials are yet to aggressively accumulate. But, per the January COT report data, they have been adding of late.
January COT Report data: Currently net long 26.6k, up 7.5k.
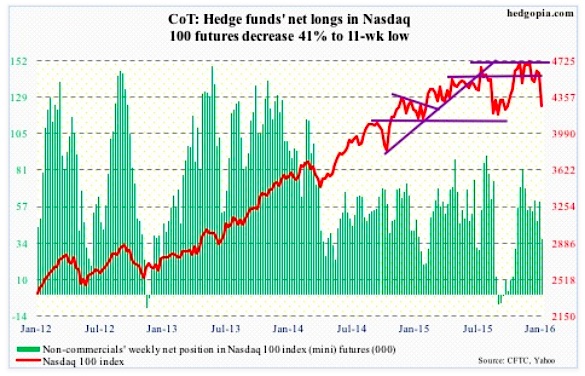
Nasdaq 100 Index (mini): Last week, the Nasdaq 100 lost 4560, which has proven to be an important line in the sand between bulls and bears. This week, it lost the 200-day moving average.
Importantly, Apple (AAPL), which makes up nearly 13 percent of the index, lost crucial support at $105-plus, completing a head-and-shoulders pattern.
More importantly, the Nasdaq 100 rallied a very strong 8.4 percent – relatively speaking – last year. But this was driven primarily by stocks like Facebook (FB), Amazon (AMZN), Netflix (NFLX) and Alphabet (GOOGL, formerly Google). Otherwise, breadth was much weaker across tech stocks.
Non-commercials reduced net longs to an 11-week low per the January COT report data.
January COT Report data: Currently net long 36k, down 25k.
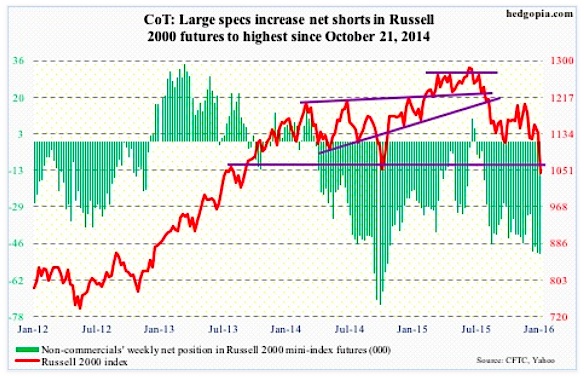
Russell 2000 mini-Index: Back in late September when the S&P 500 successfully tested the August low, the Russell 2000 index, along with the S&P 400 mid-cap index, was one of the major U.S. stock market indices to have undercut those lows.
Investors/traders were avoiding small-caps stocks then, and they are avoiding them now. This week, the Russell 2000 undercut the September low as well.
And once again, kudos to non-commercials for having so doggedly remained bearish Russell 2000 futures. They have been rewarded.
Net shorts are at the highest since October 2014.
January COT Report data: Currently net short 50.4k, up 852.
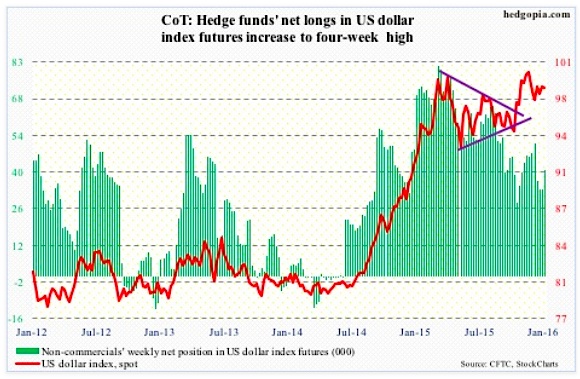
US Dollar Index: Rather uncharacteristically, the US Dollar index failed to rally on the coattails of this week’s market turmoil.
Yes, the Japanese Yen is the pre-eminent risk-averse currency and yes the euro has become a safe-haven proxy along with the Yen, but the US Dollar index’s inability to break out is probably one more sign of waning momentum.
Judging by their holdings, non-commercials have been hinting at this for a while now. Two weeks ago, they cut back net longs to a nine-week low. This week, they added some.
A peak in the US Dollar is music to the ears of U.S. exporters.
January COT Report data: Currently net long 40.7k, up 7.1k.
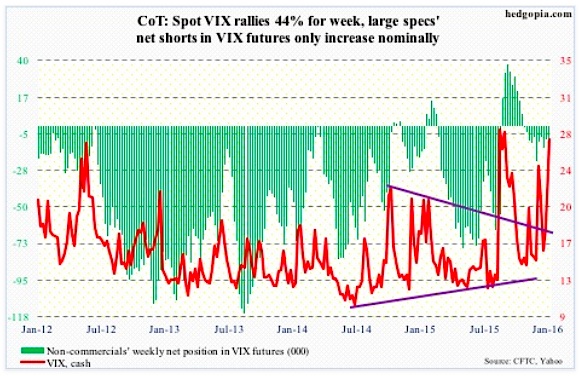
VIX Volatility Index: On December 14th, spot VIX Volatility Index shot up to 26.81 before reversing hard. The S&P 500 this week undercut the intra-day low in that session by 3.8 percent, yet the VIX could barely surpass the intra-day high back then.
Also, the S&P 500 is less than three percent from testing the August low, yet the Volatility Index has to nearly double to reach the intra-day high back then.
It is so uncharacteristic of VIX – not able to rally when the S&P 500 is taking it on the chin.
Investors/traders were either already protected or do not anticipate a bigger decline in stocks. That is one way to look at this. Using this logic, the time is perhaps right to look for signs of a spike-reversal. Not there yet.
The VIX:VXV ratio is now overbought – 1.03 – ripe enough to begin to unwind, which, should it happen, should bode well for stocks. But it needs to begin to drop.
January COT Report data: Currently net short 9.8k, up 1.4k.
Thanks for reading.
Twitter: @hedgopia
Read more from Paban on his blog.
The author does not have a position in any of the mentioned securities at the time of publication. Any opinions expressed herein are solely those of the author, and do not in any way represent the views or opinions of any other person or entity.


