One of the hottest topics in the market today is the energy sector and Crude Oil. And today the Energy Sector ETF (XLE) is nearing a breakout.
Below is a weekly chart of the Energy Sector ETF with the 50-week Moving Average and the trend line support going back to 2010.
Key takeaways:
- Trend support has become resistance and price is approaching this previously key trend line.
- Momentum has already broken above it’s level of resistance, will price be able to get above this trend line and its long-term moving average?
Energy Sector ETF (XLE) Weekly Chart
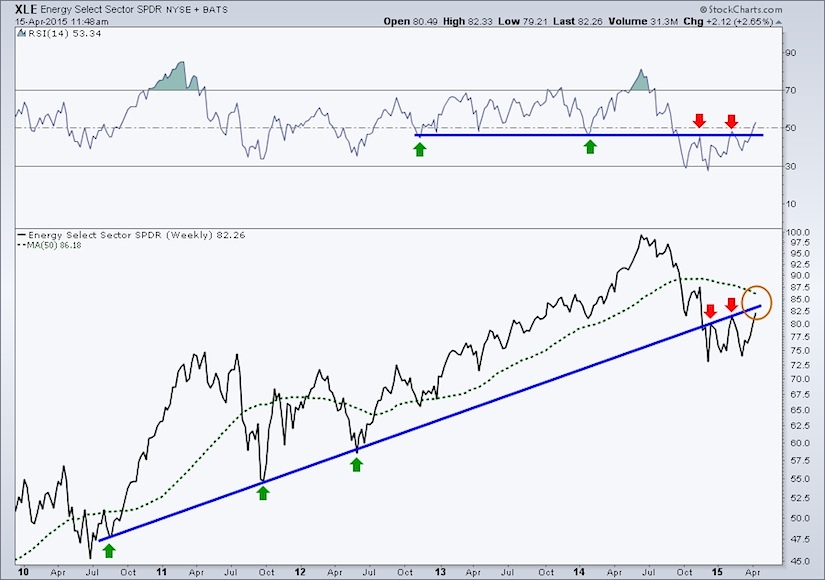
We are clearly nearing a critical juncture in time and price. Crude Oil prices will likely continue to play a role here. Stay tuned to the price action.
The information contained in this article should not be construed as investment advice, research, or an offer to buy or sell securities. Everything written here is meant for educational and entertainment purposes only. I or my affiliates may hold positions in securities mentioned.
Follow Andrew on Twitter: @AndrewThrasher
Any opinions expressed herein are solely those of the author, and do not in any way represent the views or opinions of any other person or entity.

: Worrisome to Broader Market?")

