There are several ways to process, measure, and analyze market uncertainty.
Today we’ll look at two charts that show investors uncertainty through different lenses: One focused on economic uncertainty, the other focused on the VIX Volatility Index (INDEXCBOE:VIX).
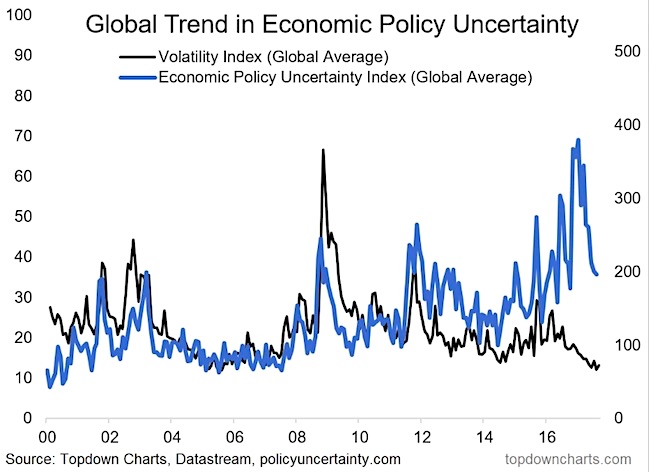
The first chart looks at the global trend in uncertainty related to economic policies.
You can clearly see the peak in economic uncertainty this year. This gauge of uncertainty has subsided considerably. This highlights, it still remains somewhat elevated.
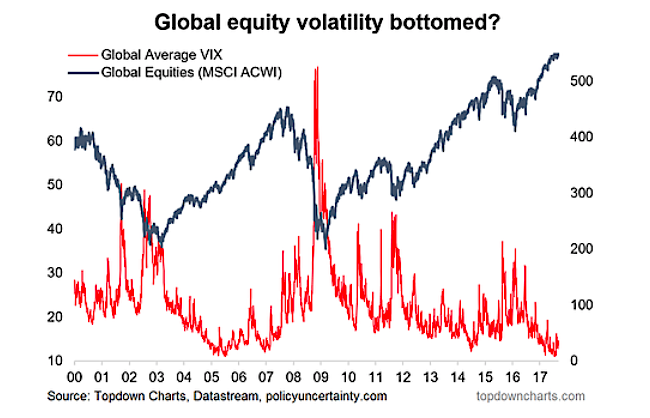
The second chart looks at the VIX Volatility Index vs the Global Equities Index (NYSEARCA:ACWI). As equities remain elevated near all-time highs, the VIX is making resting near the ’05 – ’07 lows.
Thanks for reading.
Twitter: @Callum_Thomas
Any opinions expressed herein are solely those of the author, and do not in any way represent the views or opinions of any other person or entity.


