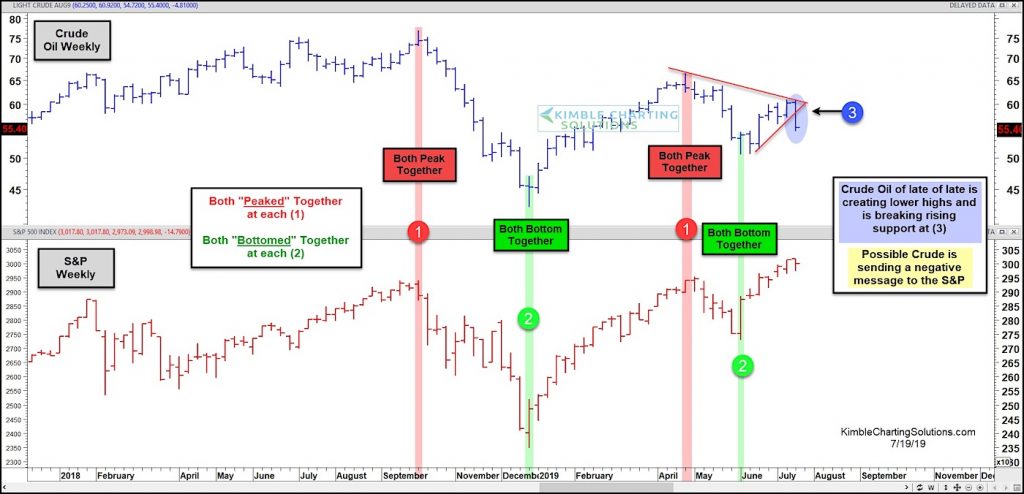
Crude Oil Prices versus S&P 500 Index Chart
Crude Oil (NYSEARCA: USO) and the S&P 500 Index (INDEXSP: .INX) have peaked and bottomed together several times in the past 9 months. See points (1) and (2) on the chart above.
In summary, the correlation between Oil and the stock market has been quite interesting and demands investors attention.
Could a bearish turn lower be on the way for U.S. stocks?
Crude Oil has been creating lower highs of late and is breaking price support at (3).
If the correlation remains the same, Crude Oil may very well be sending a bearish message to stocks.
Tricky spot for active investors – careful here.
Note that KimbleCharting is offering a 2 week Free trial to See It Market readers. Just send me an email to services@kimblechartingsolutions.com for details to get set up.
Twitter: @KimbleCharting
Any opinions expressed herein are solely those of the author, and do not in any way represent the views or opinions of any other person or entity.

: Worrisome to Broader Market?")
