2015 Market Breadth Versus 2007, 2008, 2010, and 2011
Market breadth speaks to the percentage of stocks participating in a stock market rally. All things being equal, the broader the participation the healthier the market. In this article, we will examine breadth for both the S&P 500 and NYSE Composite Stock Index. We will also examine 2015 breadth vs. similar points after a correction and similar points in a bear market. Stock market breadth is not particularly useful as a short-term timing tool for the S&P 500; it can be helpful on longer-term time horizons.
2015 Market Breadth Versus 2010-2011
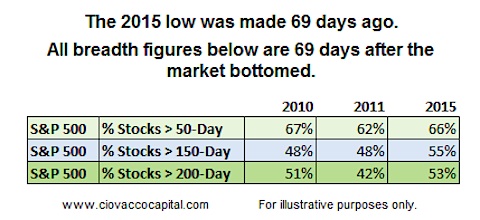
The S&P 500 bottomed on September 29, 2015 or 69 calendar days ago. It is common for market breadth to become weak during a correction and then improve after a bottom is reached. Therefore, we can gain some insight into 2015 by comparing breadth figures in 2010 and 2011 69 calendar days after the stock market made a low.
As the summary table below shows, 2015 breadth is not significantly different than at similar points during the 2010 and 2011 rallies. In fact, in some cases 2015 breadth is better.
Did Bear Markets Begin In 2010 or 2011?
The answer to the question above is no. Therefore, if 2015 breadth is similar to breadth in 2010 and 2011, it is difficult to say 2015 breadth is screaming “a bear market is imminent”. Our purpose here is not to say 2015 breadth is bullish, but rather to say:
Stock market breadth is not that bad right now relative to recent corrections. The jury is still out on the bull market vs. bear market question based on market breadth.
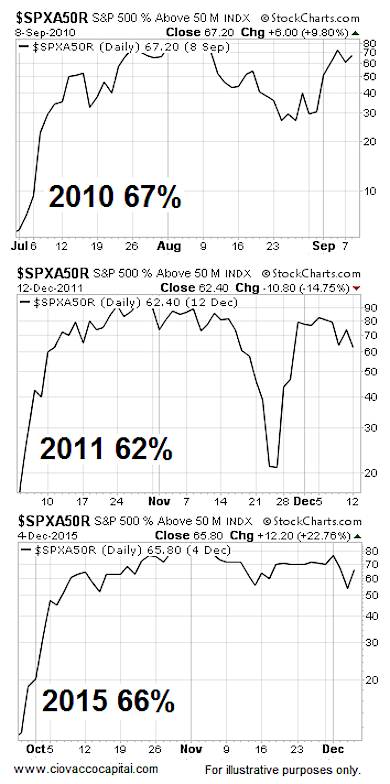
S&P 500 Stocks Greater Than 50-Day Moving Average
The 50-day moving average helps us monitor the health of short to intermediate-term trends. In 2010 69 days after the correction ended, 67% of S&P 500 stocks were above their 50-day moving average. In 2011 69 days after the correction ended, 62% of S&P 500 stocks were above their 50-day moving average. In 2015 69 days after the correction ended, 66% of S&P 500 stocks were above their 50-day moving average, which is very similar to both 2010 and 2011.
S&P 500 Stocks Percent Above Their 50 Day Moving Average
69 Days After The Low Was Made
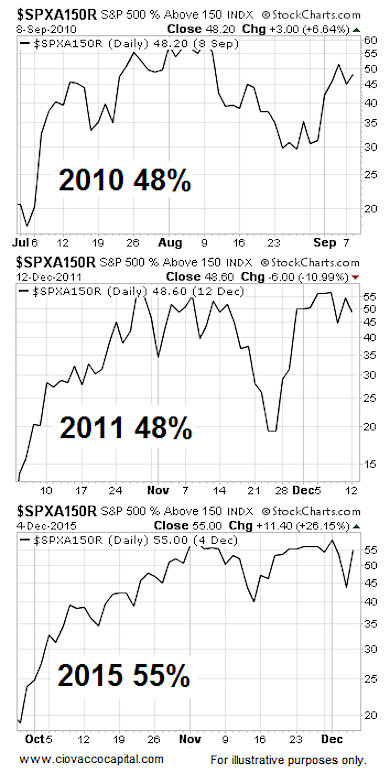
S&P 500 Stocks Greater Than 150-Day Moving Average
The 150-day moving average helps us monitor the health of intermediate to long-term trends. In 2010 69 days after the stock market correction ended, 48% of S&P 500 stocks were above their 150-day moving average. In 2011 69 days after the market correction ended, 48% of S&P 500 stocks were above their 150-day moving average. In 2015 69 days after the correction ended, 55% of S&P 500 stocks were above their 150-day moving average, which is better than both 2010 and 2011.
S&P 500 Stocks Percent Above Their 150 Day Moving Average
69 Days After The Low Was Made
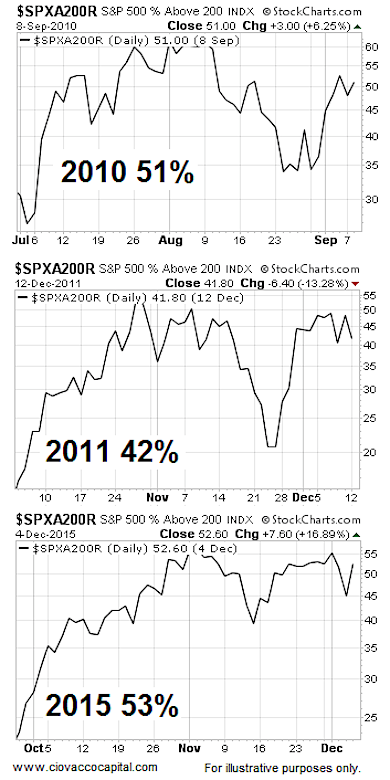
S&P 500 Stocks Greater Than 200-Day Moving Average
The 200-day moving average helps us monitor the health of long-term trends. In 2010 69 days after the stock market correction ended, 51% of S&P 500 stocks were above their 200-day moving average. In 2011 69 days after the market correction ended, 42% of S&P 500 stocks were above their 200-day moving average. In 2015 69 days after the correction ended, 53% of S&P 500 stocks were above their 200-day moving average, which is better than both 2010 and 2011. If the bull market continued in both 2010 and 2011, and 2015 market breadth in some cases is better relative to similar points in the 2010 and 2011 rallies off a correction low, then it is difficult to say breadth is a showstopper in 2015.
S&P 500 Stocks Percent Above Their 200 Day Moving Average
69 Days After The Low Was Made
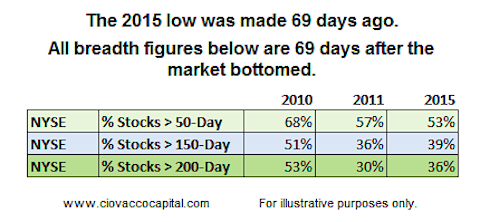
What About Broader NYSE Breadth?
The advantage of looking at S&P 500 breadth is that it only looks at liquid common stocks, however you can make the argument that S&P 500 breadth is not representative of the broader market. To take a broader view of market breadth, we will look at the same data based on the NYSE Composite Stock Index.
As the summary table below shows, 2015 breadth is not significantly different than at similar points during the 2010 and 2011 rallies. In fact, in some cases 2015 breadth is better.
continue reading on the next page…

: Worrisome to Broader Market?")
