While stocks have hit the skids a bit in the past few days, by comparison, volatility expectations have soared by an unprecedented amount. So how does the monster VIX rally stack up historically? How have stocks behaved after similar instances?
A few days ago, many stock indices were knocking on the door of new all-time highs. They have sold off a bit in the few days since. However, the real story is in the volatility market. There, we see that, despite the rather moderate stock market losses in recent days – not to mention the rather close proximity still to new highs – volatility expectations have soared by an unprecedented amount, by some measures.
What does this relatively out-sized move in the volatility market tell us about current and future markets? We’re really not quite sure. And rather than opine about the possible ramifications, this post is simply going to list a few of the milestones reached by the S&P 500 Volatility Index, a.k.a., VIX, over the past few days. We’ll also present some historical stock market and volatility performance statistics based on circumstances somewhat akin to the milestone figures of the recent VIX rally.
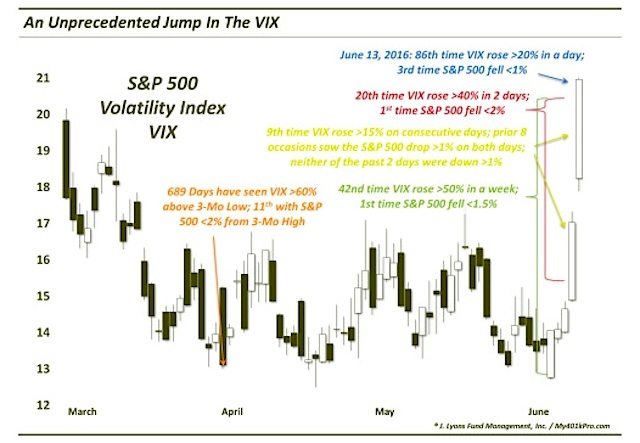
First off, what kind of jump are we talking about in the VIX? This chart lists some of the unprecedented (or nearly so) measurements of the past few days. Let’s look at that VIX rally:
To wit:
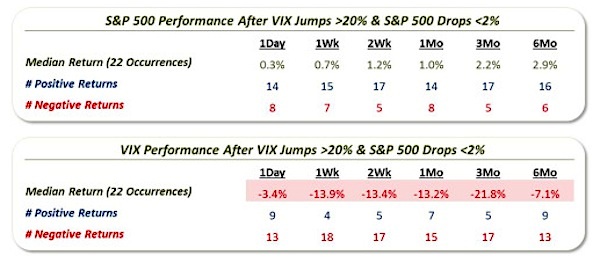
1) June 13, 2016 marked the 86th time in which a VIX rally rose >20% in a day; of those days, it was just the 3rd time in which the S&P 500 fell <1%.
Monday, the VIX rose 23% while the S&P 500 fell by only -0.8%. Only 8/11/1987 and 12/8/2014 saw the S&P 500 fall by less than 1% when the VIX was up over 20%. The following table shows subsequent S&P 500 and VIX performance following days when the VIX rises by >20% and the S&P 500 drops by <2%. For what it’s worth, the S&P 500 managed to bounce back rather consistently over the short to intermediate-term, though returns were muted. Perhaps the most consistent result was the tendency of the VIX to fall back in the short to intermediate-term.
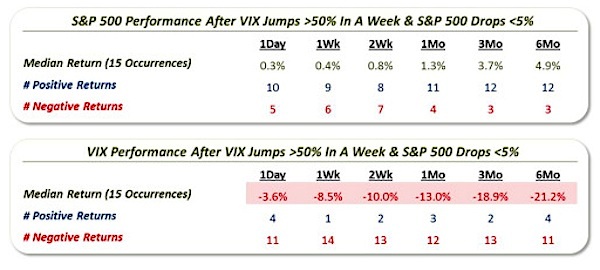
2) This marked the 42nd time in which the VIX rose >50% in a week; it was the 1st such time in which the S&P 500 fell <1.5%.
Over the past week (through Monday), the VIX rose 54% while the S&P fell by only -1.4%. The following table shows S&P 500 and VIX performance following weeks when the VIX rises by >50% and the S&P 500 drops by <5%. Like the prior table, the S&P 500 managed to bounce back rather consistently but not overly impressively over the short to intermediate-term. Also similar to the 1st table was the performance the VIX in its tendency to drop back down in the short to intermediate-term.
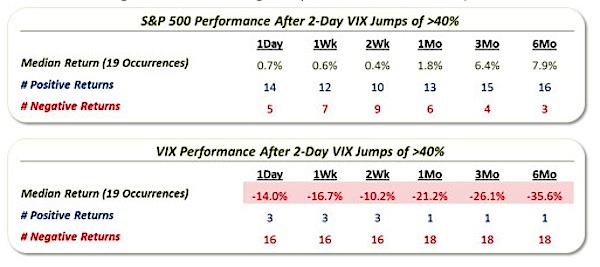
3) Friday/Monday marked the 20th time the VIX rose >40% in 2 days; this is the 1st such time in which the S&P 500 fell <2%.
During the Friday/Monday market sessions, the VIX rose by 43%. This was the first 2-day 40% rise, out of 20, that saw the S&P 500 fall by less than 2%. The following table shows subsequent S&P 500 and VIX performance following the previous 19 2-day jumps in the VIX of >40%. More so than even the prior tables, S&P 500 managed to bounce back rather consistently over the short to intermediate-term. Also exceedingly consistent was the tendency of the VIX to fall back in the short to intermediate-term. These results are likely due to much more calamitous circumstances in the market than we’ve seen in the past few days (indeed, the S&P 500 was down an average of -6.5% during the prior 19 occurrences).
continue reading about the VIX rally on the next page…
: Creating Bullish Divergence?")


 and Semiconductors (SMH): Concerning Price Pattern?")


