The following research was contributed to by Christine Short, VP of Research at Wall Street Horizon.
Key Stock Market Takeaways:
- Banks fizzle at the kick off of Q4 earnings season
- Over 60% of S&P 500 companies that have reported for Q4 have called out higher expenses, mostly labor related
- The delayer/advancer ratio improves to 0.8
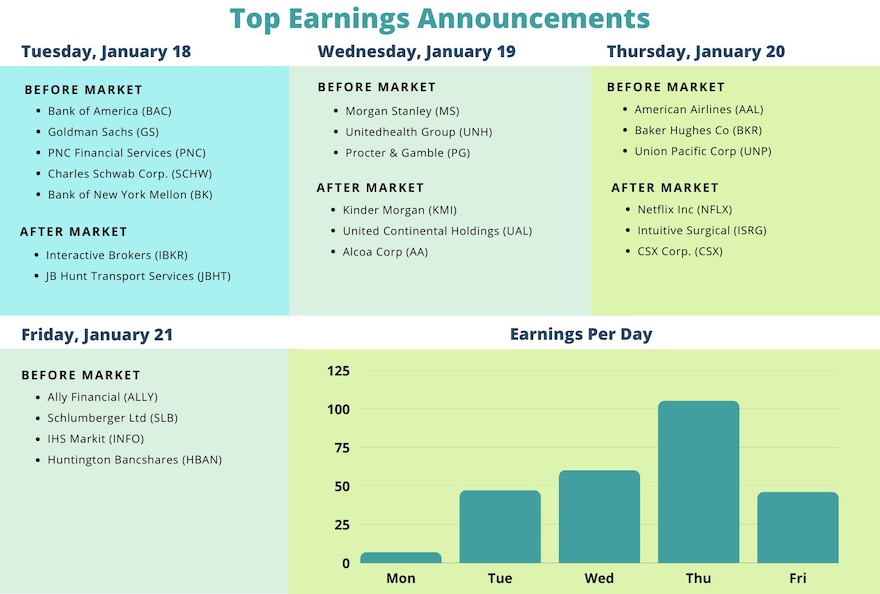
- Reports to watch this week include: BAC, GS, MS, PG, UAL, AAL, NFLX & more
- Peak earnings season runs from January 31 – February 25
Banks Kick Off Q4 Reporting Season on the Wrong Foot
In 2021 all of us that watch quarterly earnings became accustomed to big beats from a majority of S&P 500 companies, especially the banks as they start each earnings season and had easier comparisons to 2020.
That has changed this earnings season. Q4 kicked off with a whimper. In a stunning reversal from the last few years, Wells Fargo was the only big bank that beat on both the top and bottom-line and saw a pop in share prices, as the consumer bank benefitted from a pick up in consumer spending, higher fees, and increased lending in the second half of the year.
JPMorgan and Citigroup had a different fate however. JPMorgan beat on EPS (actual: $3.33 vs. estimate: $3.01*) but missed on the top-line (actual $29.25B vs. est: $29.78B*). Headwinds included higher expenses and a tightening labor market. Citigroup on the other hand surpassed revenue expectations (actual: $17.01B vs. est: $16.85B*) but missed bottom-line estimates (actual: $1.46 vs. est: $1.72*), also due to increased expenses and a decrease in revenues for their global consumer banking business. *All estimates provided by FactSet
We are still waiting on results from the remaining three big banks this week: Bank of America and Goldman Sachs on Tuesday, and Morgan Stanley on Wednesday.
Corporate Commentary Still Largely focused on Inflation, Labor Shortages and Supply Chain Disruptions
Only 26 S&P 500 companies have reported thus far, but many of the themes harped on in Q3 reports are making a comeback this quarter regardless of the sector. Increased expenses, labor shortages and/or lingering supply-chain issues have been mentioned in 60% of press releases throughout the Consumer Staples sector (Hormel, General Mills, Conagra), Industrials (FedEx, Delta) and Financials (JPMorgan, Citigroup). This paired with Wednesday’s CPI reading which showed the highest YoY inflation increase in 40 years, as well Tuesday’s JOLTS report which revealed a record number of workers quit their jobs in November, both indicating it’s hard to hire/keep employees. Expect more of these comments as we get into the peak weeks later this month.
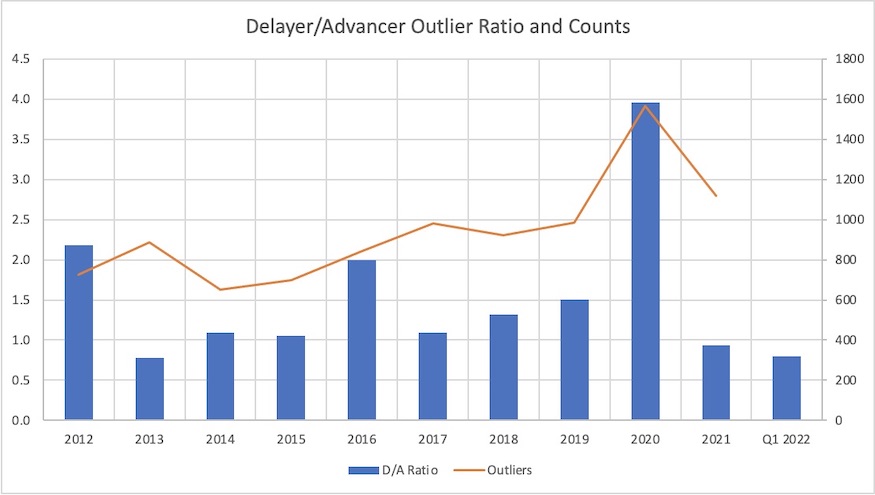
The Delayer/Advancer Ratio for Q1 Improves
Each earnings season we track whether companies report sooner, later, or in-line with their historical reporting date. Academic research shows that when a company delays earnings, bad news typically follows on the earnings call. Similarly, advancing an earnings date is highly correlated with good news being shared on the quarterly call. We find the delayer/advancer ratio to be a good indicator of corporate health.
Looking at just US companies with a market cap greater than $250M, the delayer/advancer (D/A) ratio for Q4 earnings has dipped to 0.8 from last week’s 1.2, meaning slightly more companies are advancing earnings than delaying them. This is below the 10-year average of 1.1, and a good sign of what could be shared on upcoming earnings releases. It’s important to keep in mind, however, that it is still very early in the season, and only about a third of companies have confirmed earnings dates at this juncture.
The chart below shows the D/A ratio for each of the last 10 years as well as for Q1 2022, and outlier counts (delayers and advancers) for each period.
Reporting this week:
This week Financials continue to report, and we start to hear from names in the Industrials and Health Care spaces.
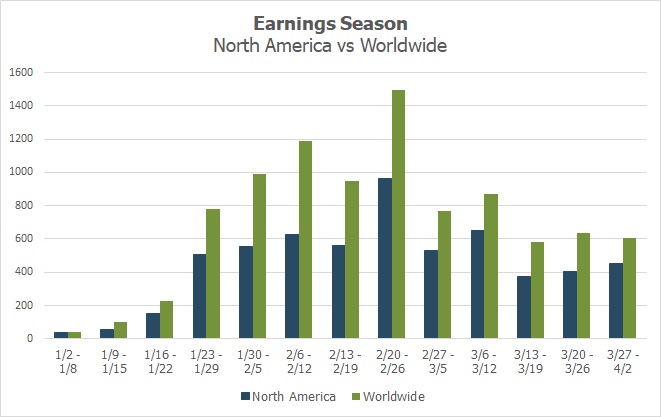
Earnings Wave
This season peak weeks will fall between January 31 – February 25, with February 24 predicted to be the most active day with 820 companies anticipated to report. Only ~36% of companies have confirmed at this point (out of our universe of 9,500+ global names), so this is subject to change. The remaining dates are estimated based on historical reporting data. Keep in mind the Q4 reporting season is always a bit more prolonged, typically stretching over 4 peak weeks rather than the usual 3 peak weeks seen in Q1 – Q3.
For more information on the data sourced in this report, please email: info@wallstreethorizon.com
Wall Street Horizon provides institutional traders and investors with the most accurate and comprehensive forward-looking event data. Covering 9,000 companies worldwide, we offer more than 40 corporate event types via a range of delivery options from machine-readable files to API solutions to streaming feeds. By keeping clients apprised of critical market-moving events and event revisions, our data empowers financial professionals to take advantage of or avoid the ensuing volatility.

Christine Short, VP of Research at Wall Street Horizon, is focused on publishing research on Wall Street Horizon event data covering 9,000 global equities in the marketplace. Over the past 15 years in the financial data industry, her research has been widely featured in financial news outlets including regular appearances on networks such as CNBC and Fox to talk corporate earnings and the economy.


")

 Rolling Over At Key Fibonacci Level?")

