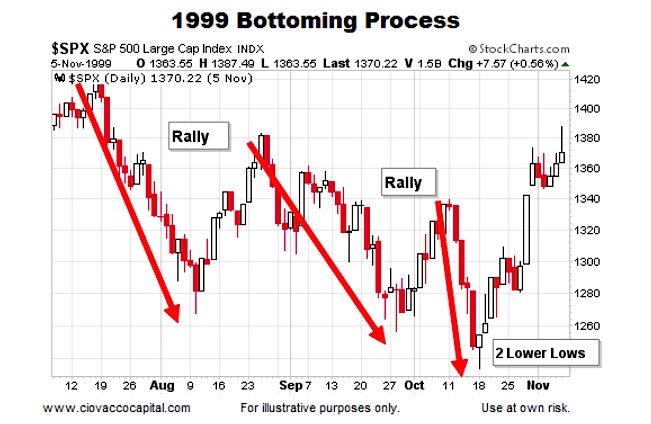
1999 – “Cowboy”
In 1999, a guy from Detroit said he “wanted to be a Cowboy”, which seemed a bit odd. Stocks were dealing with an odd fear about computers crashing at midnight on December 31. Many countertrend rallies were fully retraced before a final low was made and a stock market bottom formed.
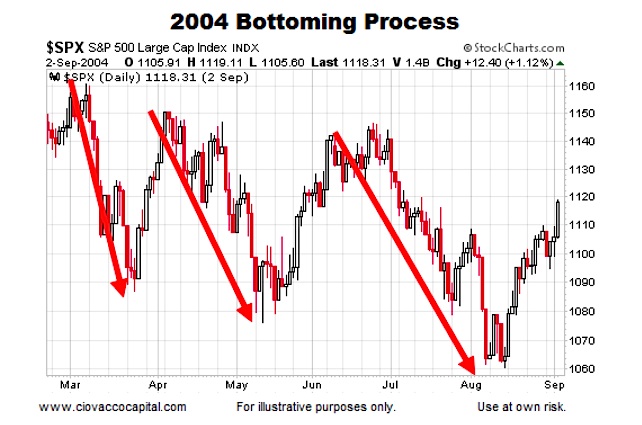
2004 – “Are You Gonna Be My Girl?”
A band named Jet asked an age old question. Stocks were a mess, making three lower lows during an established daily downtrend.
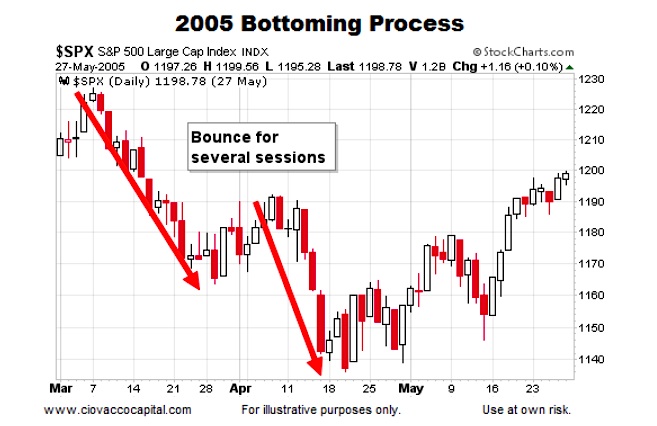
2005 – “Beverly Hills”
Weezer’s song about Jed Clampett’s stomping ground seemed to fit well with the still inflating housing bubble. Stocks found “a low” in March before making “the low” in April.
2006 – “Crazy”
Gnarls Barkley had many of us sports fans wondering if things were amiss with the spell checkers. “Crazy” fit right in with housing prices. Rather than dropping for five minutes and then going on to make a new high (see 2013-2014), the S&P 500 followed a more traditional “bottoming process” path.


