The rotation out of growth and into value as we started 2022 has been, well, violent. As of Thursday, January 20, the S&P 500 Growth Index was down 9.6% so far this year while the value version of the index is off a mere 1.8%.
If January ended now, this month would rank in the top 10 months measured by divergence of one style over another during the past 25 years. Keep in mind, that time period includes three bear markets and the tech boom/bust.
Growth has been dominating value for much of the past decade, with the S&P 500 Growth Index rising 457% (18.9% annualized) compared to 231% for value (12.8% annualized). Could the leadership have just abruptly changed as Time Square’s New Year’s ball dropped?
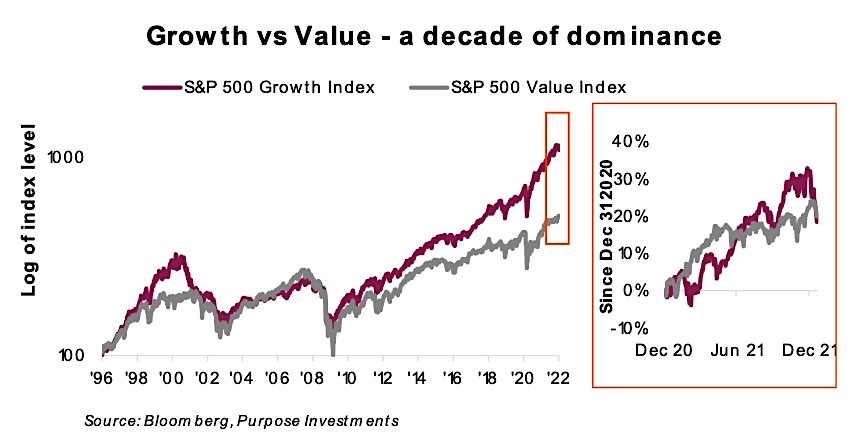
Looking at the above chart, one could easily argue that growth had gone too far relative to value and is due to revert. Mean reversion is one of the more reliable forces in the capital markets. That said, you could have made the same argument at any point over the past three plus years. But this potential change in leadership may not be as abrupt as many believe. Value and growth in the U.S. large cap market have been battling it out for over a year now (same chart, orange box on the right).
We believe we are partway through a potential transition phase that will continue to see value and growth competing for control. While the relative outperformance of value so far this month is extreme, growth outperformed value by 7% last June, a mere six months ago. It’s noteworthy that most months that witnessed >5% outperformance by either style occurred at the tail end of the tech bubble and subsequent leadership change. If the pattern has any similarity to the early 2000s, this volatile seesaw leadership will be the norm for a while.
Now it is possible this is simply another wobble in the growth market that will pass and see the dominance over value continue – there have been many such wobbles over the past decade. Change in leadership is only 100% certain well after it has occurred but that does little for investment positioning. That said, we believe the deck has become increasingly stacked against growth.
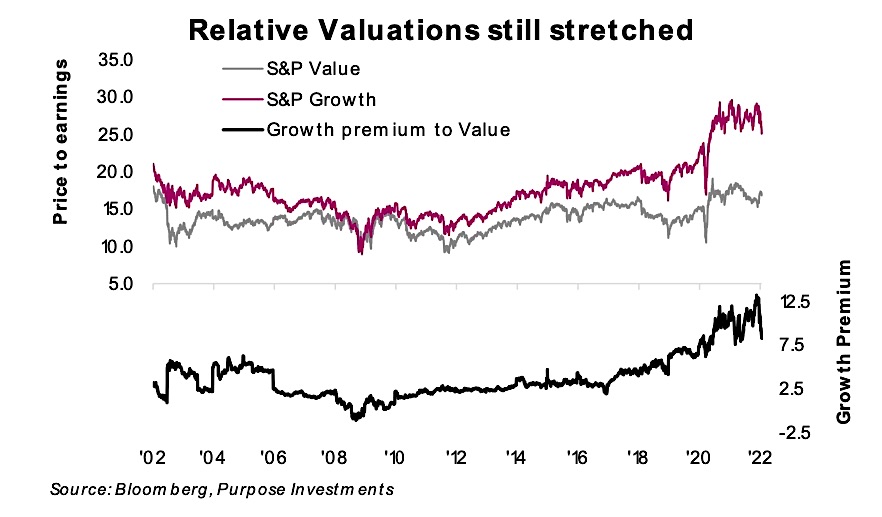
Valuations – Historically, growth names have traded at a premium valuation to value. They are growing faster by definition, so should have higher multiples. Yet the multiple premium reached last year was extreme. The valuation spread has come back down a little but remains historically elevated. In other words, value compared with growth is cheap based on historical relative valuations.
Inflation & yields – Bond yields have certainly been trending higher with the U.S. 10-year Treasury bellwether now in the 1.80s. Given that growth companies tend to have more of their earnings further down the road, higher yields result in a higher discount rate being applied to these future earnings. This too favors value over growth.
Concentration – The U.S. equity market has become very concentrated among a number of megacap names, and they are all growth. While the larger names in the S&P 500 in the late 1990s were certainly tilted towards more tech names, there were some non-tech names as well. Today, the top S&P 500 names are Apple (6.7%), Microsoft (5.9%), Amazon (3.5%), Alphabet (4.1%), Tesla (2.1%), Meta (2.0%), Nvidia (1.6%), and then finally Berkshire (1.5%, although BRK’s share of AAPL is equal to 20% of its market cap). You have to go down to #8 before hitting a company not loosely classified as tech. This concentration carries added risk.
Investment implications
Of course, we cannot be certain this long overdue rotation is on or if this is just another test of the entrenched leaders. Softer inflation data could easily have the central banks slowing their tightening plans. Q4 earnings season could provide more solid encouragement, and softer economic data could tame yields back down a bit. Any of these scenarios could easily reverse the recent weakness in growth stocks, re-establishing the trend of low rates = good for growth.
This is an earlier-than-expected taste of the more volatile 2022 we highlighted in our outlook. As before and now, we see greater safety in value relative to growth, even with the NASDAQ down 10%. Our approach remains to be a bit underweight U.S. equities and have a more value tilt for the remaining allocation. For us, this means some U.S. exposure with a dividend focus and holding an equal weighted S&P ETF.
Equal weight is an easy way to remain exposed to many of the great companies that make up the U.S. equity market — there are many great companies — without the concentration issues of the megacaps tech names.
Value is also much more prevalent in Canada and internationally: our two equity overweights. After last year’s strong earnings growth globally, valuations in Europe, Asia, and Canada have all come back down to more normal historical levels. Sure, these companies may not be as exciting to share stories about at (virtual) cocktail parties, but then again, we are not storytelling investors.
Sources: Charts are sourced to Bloomberg L.P., Purpose Investments Inc., and Richardson Wealth unless otherwise noted.
Twitter: @ConnectedWealth
Any opinions expressed herein are solely those of the authors, and do not in any way represent the views or opinions of any other person or entity.
")


 Rolling Over At Key Fibonacci Level?")
