Unlike some attractive investments, gold tends to shine the brightest during times of market turmoil.
Our macro view places us in the late stage of the market cycle and we expect bouts of volatility to be more common and violent.
This week we are talking gold and why we think investors should have at least some exposure to the yellow metal. Whether physical or via the gold miners (NYSEARCA: GDX), adding this undiversified asset class is a great way to lower portfolio volatility, which makes riding the waves of market instability slightly less woozy.
Let’s look at some gold charts…
Chart 1 show how gold has performed since the end of August.
Gold bottomed on August 18th, with a low of $1,182/oz. The low preceded the eventual sell-off in the broader equity market, and gold rallied as equities delved deep into the correction zone, continuing into the new year thanks to the U.S. government shutdown and lingering recession worries. The Fed’s pivot also benefited the metal: the pause in the continued monetary tightening resulted in less concern of rising rates.
Following four consecutive positive months for both gold and gold mining stocks, February saw both a new high of $1349 and a sell-off that cumulated in the metal falling $20/oz on Friday, causing gold to have its worst week in some while.
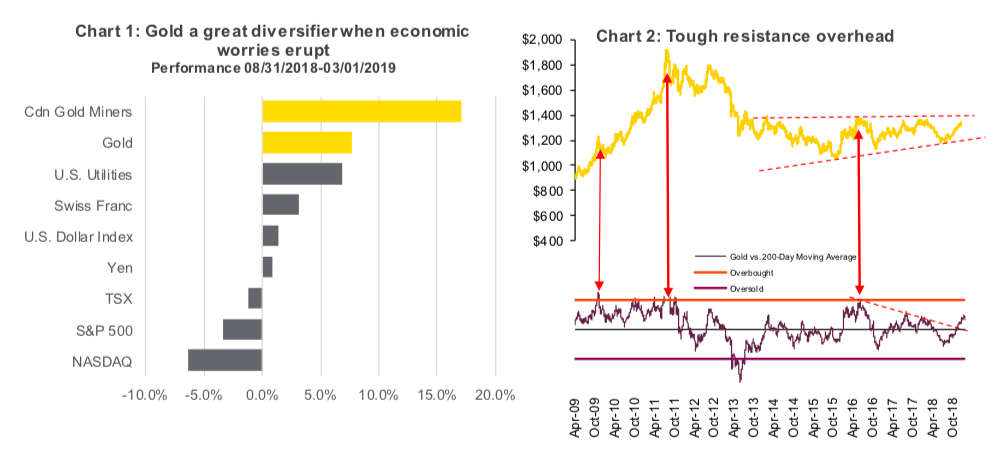
From a technical perspective, $1,350/oz has proven to be a tough nut to crack. (Chart 2 above) After bottoming in late 2015, gold prices have tried to break through this key resistance level now four times. The long consolidation continues, but we would point out the series of higher lows and longer-term moving averages which have begun to have slope upward. Both indicative of a future bullish breakout.
Will we see reduced volatility (consolidation) in gold over the next year? Possibly, but sometimes it’s important to be more forward looking and address ways to insulate portfolio’s down the road.
Important relationships and price drivers
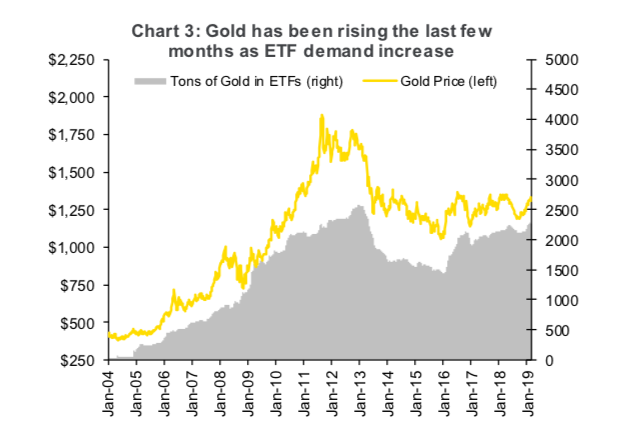
ETF fund flows have been rising of late. Gold-focused exchange-traded funds added nearly 111 tons of over the past four months (Chart 3 below). It’s clear that investors are buying gold again as concerns about a slowing global economy put a premium on safer investment. The multiple corrections last year should make it clear that the previous amount of complacency in the market is unwarranted. It’s important to measure and dial back risk when necessary and build up a hedge.
Investors aren’t the only ones seeking out gold. Beyond Maduro allegedly sneaking out 8 tons of it out of Venezuela recently, central banks have been very interested. They bought the most gold by volume last year since 1967, according to the World Gold Council. Central banks net purchases reached 651.5 metric tons in 2018. Russia has been a big buyer, as they continue to reduce U.S. Treasury holdings to reduce dependence on the U.S. dollar.
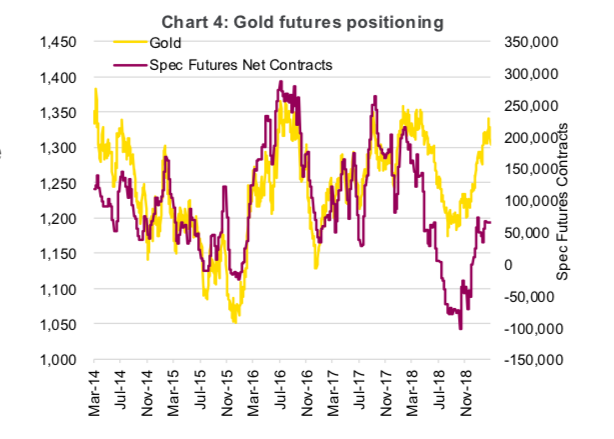
Funds have been increasing their bets on gold over the past couple of months as well. Futures contracts have moved off the extreme net-short reading set last fall as long contract demand has been increasing. Looking back five years, Chart 4 shows that the despite now being net-long the positioning is anything by exuberant. As a contrarian indicator, this could still support higher prices.
Being priced in U.S. dollars, the relationship to the currency is naturally inverse. We’d like to point out that the negative correlation to the greenback has been falling. Recently, we have witnessed a period of U.S. dollar strength and gold strength. Chart 5 shows gold and the 90-day correlation to the U.S. dollar. Both are safe havens, but the fact that gold was able to rally in spite of dollar strength is impressive.
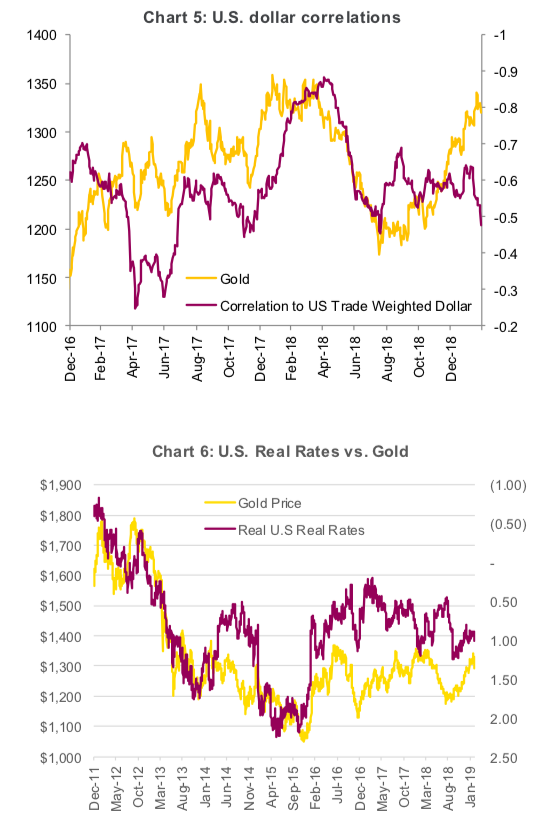
Perhaps the most dominant driver of gold prices is real bond yields. Real bond yields take both the nominal rate as well as inflation into account. Gold draws more investor interest when borrowing costs fall, in part because lower rates negate the disadvantage of holding a no yield asset and $1,800 $1,700 because rates tend to move lower when uncertainty rises. Rising rates tend to hurt gold demand (Chart 6 above), but nominal rates could very well rise with real rates falling if inflation begins to take hold. The recent pause from the Fed, with record unemployment may provide the type of environment for inflations green shoots to flourish.
Within many of the mandates we manage, we some gold exposure. Gold exposure within our Managed portfolio’s ranges from 2.3% to 4.1% depending on risk tolerance. The Purpose Core Equity Income fund is overweight gold miners and even our Tactical Asset Allocation fund has weighting with the discretionary component. There are many options to gain exposure such as: physical, ETFs or individual equities.
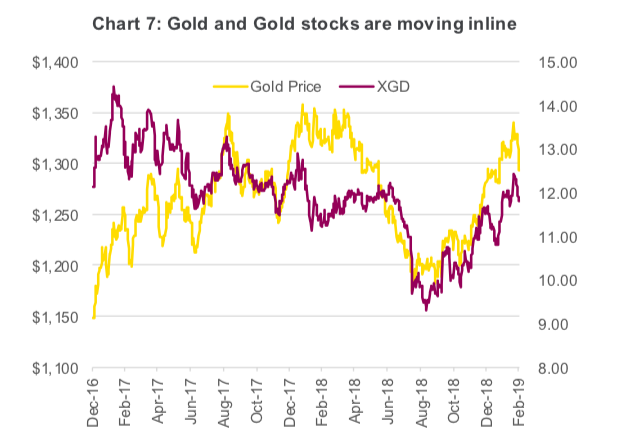
Physical gold can be rather cumbersome to obtain, store and transact with. ETFs are a great option to gain exposure to the underlying, to either gold or gold miners. Gold miners are back making headlines, with a recent bout of mega-mergers. It’s also worth pointing out that the miners have been doing a good job of moving with the metal, as Chart 7 illustrates.
Gold is a compelling choice for money managers seeking to hedge their portfolios at a time of anxiety over economic growth and trade conflicts. Gold might not pay any interest, but in a world of negative bond yields this is still a positive carry compared to other ‘safe’ investments. Gold might have lost some of its sheen during the rise of Bitcoin, but the crash of the digital currency proves that sometimes analog is best. You can’t get more analog than a substance that’s been a store of value for thousands of years.
Charts sourced to Bloomberg unless otherwise noted.
Twitter: @ConnectedWealth
Any opinions expressed herein are solely those of the authors, and do not in any way represent the views or opinions of any other person or entity.


