Gold Prices Still Looking Higher
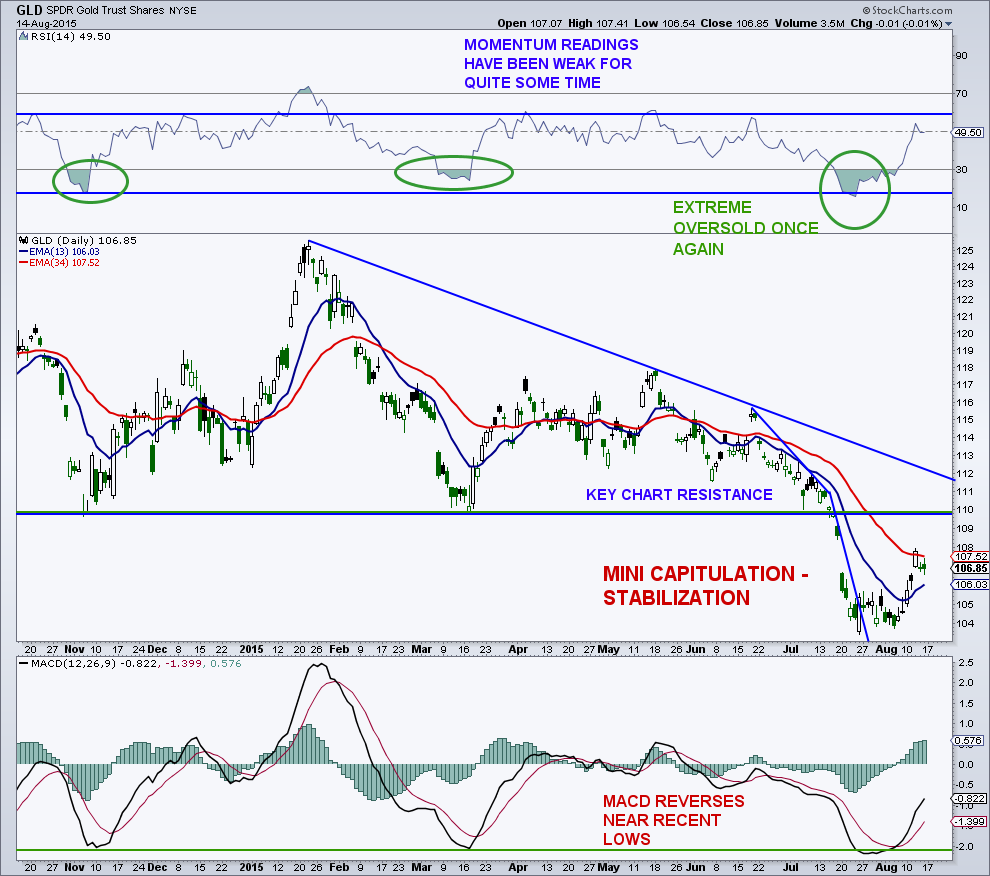
The SPDR Gold Trust ETF (GLD) broke out of a small price consolidation this week and looks to have a clear shot of rallying back up to its breakdown area of 110. Because GLD fell so sharply following its breakdown below 110, there is virtually no chart resistance on the way back up to that level.
As I said last week, there were a number of technical and market sentiment readings that suggested Gold prices may break higher. For now, the Gold ETF has turned the corner on a short term basis. And if GLD can get through 110, trendline resistance (off the peaks since January) doesn’t come in until the 112 area.
Gold sentiment remains down near the levels seen in July 2013, which led to an 8-week, $170/oz. rally. And commercial hedgers (smart money) have raised their net gold futures positions to the highest level since December 2001, when the price of gold was below $300/ounce. In sum, the indicators favor more upside over the near-term.
Crude Oil Very Oversold
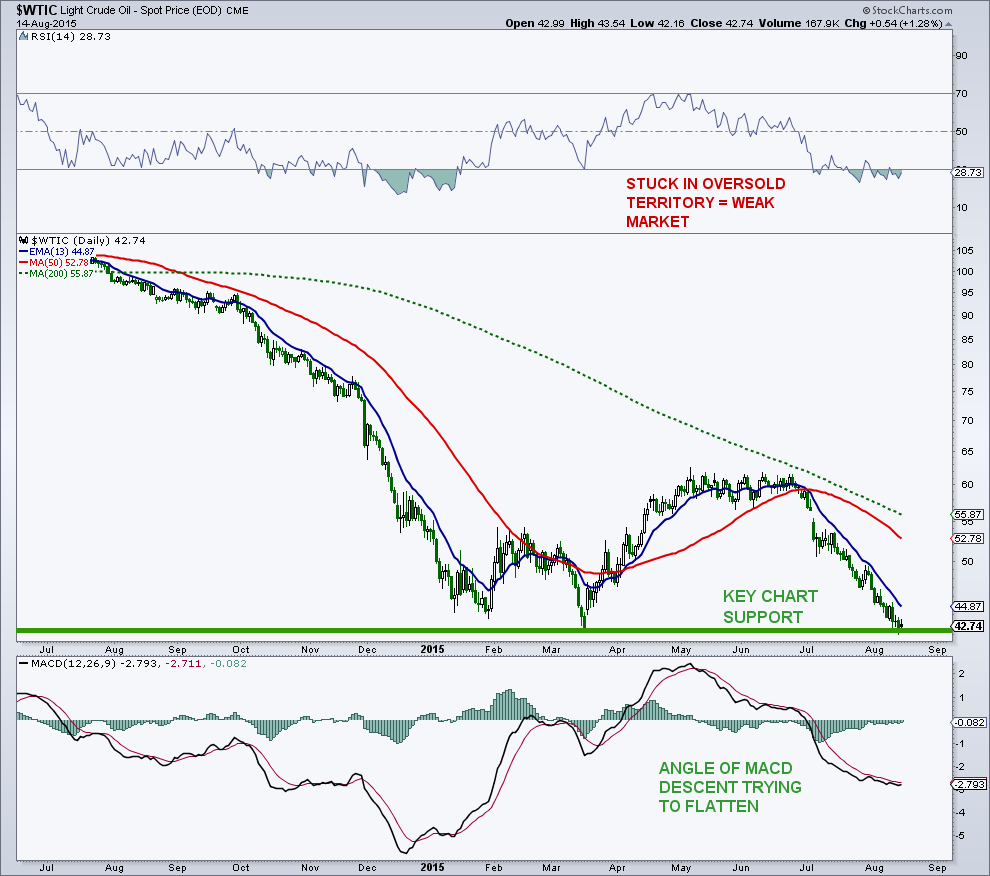
West Texas Intermediate Crude Oil (WTI) dropped to new bear market lows today, as the carnage in the energy complex continued unabated. This reminds me of 2007 and 2008 in reverse when crude oil prices jumped from $50/barrel all the way to the mid 140’s, and basically in a straight line.
Oil Sentiment is getting extreme as well. At the peak, we heard calls for $200 oil and high prices for as far as the eye could see. Now, while a 3 before the price looks possible, we are now hearing $20 for crude once again. Eventually, mean reversion will occur and crude oil will find some equilibrium as far as supply and demand goes. Since the middle of May, commercial hedgers have been increasing their net futures position in crude while large speculators have cut their net exposure to the crude oil futures market.
This suggests that a bottom may not be too far off in the future, as it is similar (but not quite as bullish) to the COT data setup that was seen in March near the prior low.
In addition, there are plenty of oil stocks that have rallied nicely while crude oil has continued lower. Stocks will generally lead a commodity at a bottom and a top.
Note that I also run a premium newsletter. Please reach out to me on twitter or at arbetermark@gmail.com if interested. Thanks for reading and have a great weekend.
Twitter: @MarkArbeter
The author does not have a position in any mentioned securities at the time of publication. Any opinions expressed herein are solely those of the author, and do not in any way represent the views or opinions of any other person or entity.


