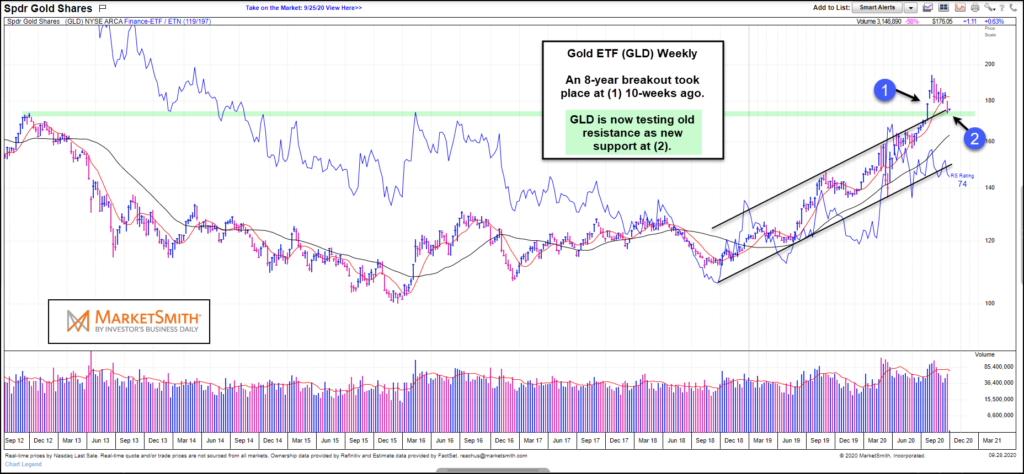
Gold ETF (GLD) “weekly” Chart
It’s been a heck of a year for Gold. But the year isn’t over yet and precious metals investors are hoping it will close the year out strong. That may depend on what happens in the coming days/weeks.
In today’s article, we feature a “weekly” chart of the Gold ETF (GLD), highlighting its strong up-trend channel and summer breakout to new all-time highs at (1). Recently, I provided an update on why Gold could be headed to $3,000 before this new bull market is over.
But as investors are aware, not all breakouts are created equally. Some breakout and run higher, some breakout and back-test support before heading higher, while other breakouts simply fail.
The past several weeks have seen Gold prices pullback to test breakout support at (2). This price area is critically important as old resistance (upper trend line and prior all-time highs) has become new support.
Bulls would love to see a rally take place off this dual support test. Stay tuned!
Note that KimbleCharting is offering a 2 week Free trial to See It Market readers. Just send me an email to services@kimblechartingsolutions.com for details to get set up.
Twitter: @KimbleCharting
Any opinions expressed herein are solely those of the author, and do not in any way represent the views or opinions of any other person or entity.

: Worrisome to Broader Market?")

