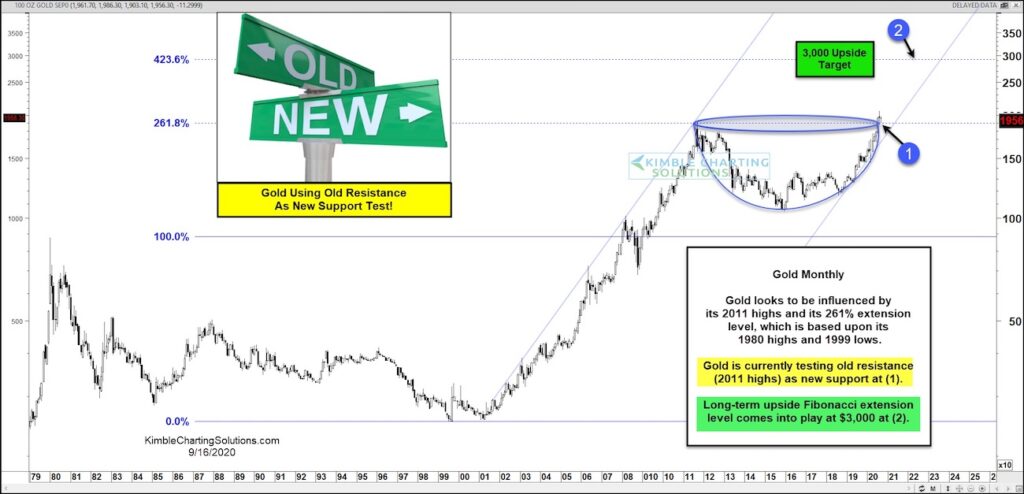
Gold “monthly” Price Chart – Targeting $3000?
90-days ago this cup & handle pattern was discussed on See It Market when Gold was trading at 1717.
Fast-forward to today and Gold is up 15 percent. So it’s time for an update!
As we pointed out 90-days ago, the initial price magnet for the rally was the 261.8 Fibonacci extension that marked the 2011 high at (1).
That high have served as price resistance for nearly 9 years! …But it may be turning into support now.
Gold has rallied sharply up the right side of the pattern and pushed past its 2011 highs. In fact, the “monthly” candle is currently attempting to break out, and should it hold, would target the next Fibonacci extension at (2). As we pointed out 90-days ago, that target comes in at $3,000! Stay tuned!
Note that KimbleCharting is offering a 2 week Free trial to See It Market readers. Just send me an email to services@kimblechartingsolutions.com for details to get set up.
Twitter: @KimbleCharting
Any opinions expressed herein are solely those of the author, and do not in any way represent the views or opinions of any other person or entity.
: All Energy Hands on Deck!")


: All Energy Hands on Deck!")