Gold “monthly” Price Chart
The slow and steady rise in gold prices over the past 4 years has created seen Gold recover a majority of its losses post 2011 highs.
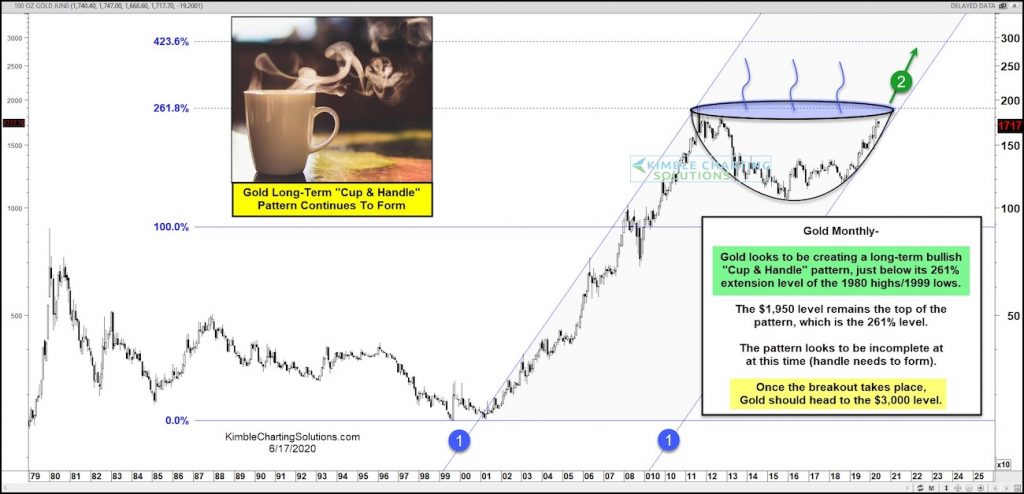
It’s also helped to form a potentially bullish price pattern: the Cup and Handle pattern. This spring I showed how the “cup” was in formation… now it appears to be nearly complete.
The rally has Gold continuing higher toward the 2011 price high, also marked by the 261.8 Fibonacci extension (of the 1979 high / 1999 low).
This has formed a symmetrical “cup”. Now we wait to see if the “handle”.
Gold bulls would love to see a pullback that re-energizes buyers and burst back up through the 261.8 Fibonacci level.
That type of breakout action from this pattern could see Gold target the $3000 price level. Stay tuned!
Note that KimbleCharting is offering a 2 week Free trial to See It Market readers. Just send me an email to services@kimblechartingsolutions.com for details to get set up.
Twitter: @KimbleCharting
Any opinions expressed herein are solely those of the author, and do not in any way represent the views or opinions of any other person or entity.

: Worrisome to Broader Market?")

