The strong rally in precious metals in recent weeks has caused us to reevaluate our gold forecast, and evidence points to gold and silver having put in durable lows late in 2015.
This suggests profitable strategies for those who are working on both medium-term and long-term time frames. Here we describe our primary scenario for the path forward by charting the SPDR Gold Trust (symbol GLD) as we plot our gold forecast.
Turning to Gold prices (and GLD – chart below), the overlapping downward pattern that lasted from 2013 through most of 2015 was notoriously difficult to count. That said, it had all the hallmarks of an ending pattern. When gold prices broke clearly out of the pattern last month, it signaled that the decline was complete and that a new pattern was beginning for gold prices and GLD.
Also, because the entire decline from gold’s 2011 high had a corrective form, we conclude that the next large-scale move should be impulsive, using Elliott wave terminology. In other words, on a large scale the next stage in gold prices and GLD should be a lengthy upward move consisting of five sub-waves.
The monthly chart below depicts the first segments of the expected large structure with upward wave (i), downward wave (ii), and upward wave (iii) possibly stretching into the next decade. Not drawn on the chart are the subsequent downward wave (iv) and upward wave (v). Eventually, the big pattern should take gold prices to new highs.
Gold ETF (GLD) – Monthly Chart
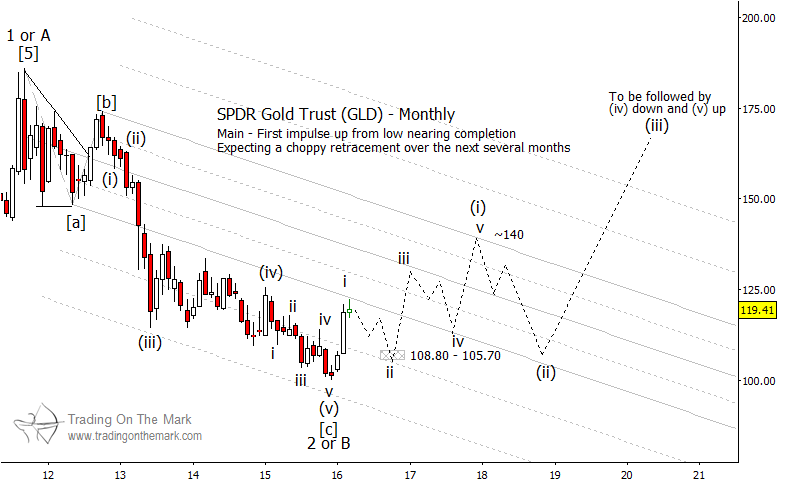
As suggested by this gold forecast, long-term traders and investors should be watching for retracements at which they may be able to shop for bullish positions. Within large wave (i) on the chart, at least two major retracements – labeled as sub-waves “ii” and “iv” – should present themselves during approximately the next two years. Specifically, if upward wave “i” is now complete, then the support zone near 105.70 to 108.80 represents a likely area for wave “ii” to end and wave “iii” to begin.
Also during the next two years, experienced traders operating on faster time frames should be aware of downward opportunities for trades that might last a few days or weeks when gold prices embark on wave “ii” and wave “iv” retracements. For those who are skilled at countertrend trading, the Schiff channel drawn on the chart offers some possible resistance areas to watch for the upward sub-waves to terminate.
For example, gold prices (represented by $GLD here) have already recognized the main lower boundary of the channel in what might represent the end of upward wave “i”. So near-term caution may be advised.
The path we have drawn for GLD is somewhat speculative. It seems likely that price action during the next two years will be choppy, consistent with the prospect of an upward diagonal pattern with overlapping waves. This view is informed by our belief that the current period of deflation with respect to commodities is not yet over. During that time, a generally rising U.S. Dollar will make it difficult for the price of gold (as denominated in Dollars) to skyrocket, even though more buyers should start coming in for the metal – ultimately, this should aid the gold forecast. Eventually, perhaps later this decade, a stronger upward wave (iii) should be possible after deflation has run its course.
Our newsletter this month discusses the next big development in interest rates and treasuries. Click here to request your copy!
Further reading from Trading On The Mark: “Why A US Dollar Rally May Be Brewing“
Twitter: @TradingOnMark
No position in any of the mentioned securities at the time of publication. Any opinions expressed herein are solely those of the author, and do not in any way represent the views or opinions of any other person or entity.


