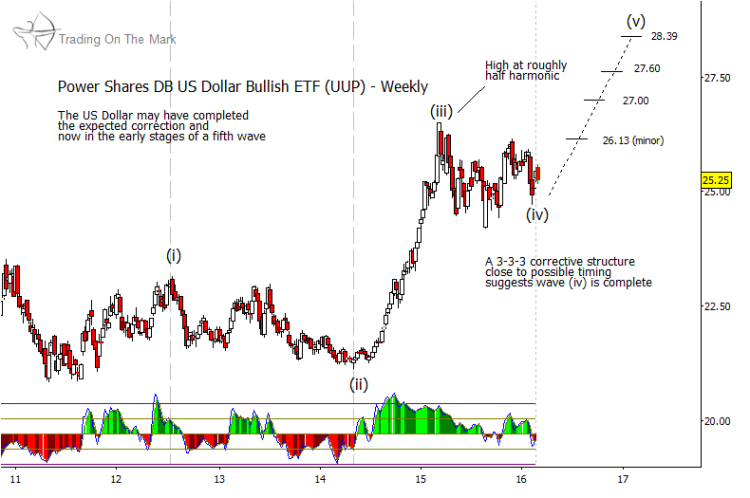
When we last wrote about the PowerShares U.S. Dollar fund (symbol UUP), it was working through the final stages of what we believe was a fourth-wave correction – one that had persisted for almost a year. Although the last leg of the correction did not venture quite as low as our target area, it came close.
More importantly, the wave structure of the last leg appears complete now, which would make the entire corrective structure complete. This would also set up for the next wave higher in a broader US Dollar rally.
On the weekly chart below, you can trace a typical corrective pattern that began at the early-2015 high labeled as wave (iii). The entire structure consisted of three waves (down, up, down), and each of those waves consisted of three sub-waves. We would have had a slight preference for the final wave to contain five sub-waves instead of three, and also for the final wave to reach our target zone of 24.15 – 24.50. However, the fact that the recent “small” US Dollar rally overlapped the first downward sub-wave suggests that the whole thing is probably finished and that it is time to look upward.
This situation in the US Dollar ETF (UUP) probably offers a good opportunity for long-term position traders. The US Dollar Index, on which UUP is based, should begin forming a large upward fifth wave that could continue into 2017 or possibly even later. Traders who begin entering long positions nearby will likely need to tolerate some negative price movement (or expect it). (If price ventures beneath the recent low of 24.72, then the next area to watch for an upward reversal would be the original target zone mentioned earlier.)
Looking ahead, big wave (v) of the US Dollar rally should consist of five sub-waves. Within that structure, it also would be possible for any of waves ‘i’, ‘iii’, or ‘v’ to extend by developing their own recognizable sets of five sub-sub-waves. The target areas for the coming US Dollar rally are shown on the chart below along with suggested areas to watch for price to pause (or for sub-waves to reach their completion within the larger structure). Based on big-picture relationships, those targets / areas are 26.13, 27.00, 27.60 and 28.39. We will be able to refine those levels as additional price data come in.
Our newsletter this month discusses the big picture in interest rates and treasuries. You can gain access to our newsletter here!
Further reading from Tom & Kurt: “Russell 2000 Approaching Next Downturn“
Twitter: @TradingOnMark
No position in any of the mentioned securities at the time of publication. Any opinions expressed herein are solely those of the author, and do not in any way represent the views or opinions of any other person or entity.


