The Index Futures Market – Big Picture
I always find it helpful to go back to the prior trading week and review the setups and what happened. Sometimes taking a step back allows us to better see where the market is situated and where stocks may be headed.
I think this also allows for higher probability setups because we have a better idea of the overall market direction and particular trend. It’s your patience and discipline that will continue to grow as a trader when you implement such practice.
Okay, let’s start the review what happened and finish with a look ahead…
The Week Behind
One month down. Whew. What a ride it has been. After three weeks of selling, the futures market on Friday found some lift after consolidation at the lows. And this helped the various stock market indexes to rocket higher into week/month end.
It was a tough week for traders as the futures market was very choppy. We had to deal with FOMC minutes, GDP, global central bank action, and some big econ numbers. This send stocks chopping up and down all week.
While there are always ticks to be made on some nice intraday swings, we remain in a daily/weekly/monthly trend downside and the short term picture is neutral, in my opinion.
Daily gaps/open VPOC’s remain above and below the current price action – all viable targets on any given day. Fridays session appeared to be the breakout of the weeks consolidation, but follow through will be important for any short-term trade confirmation.
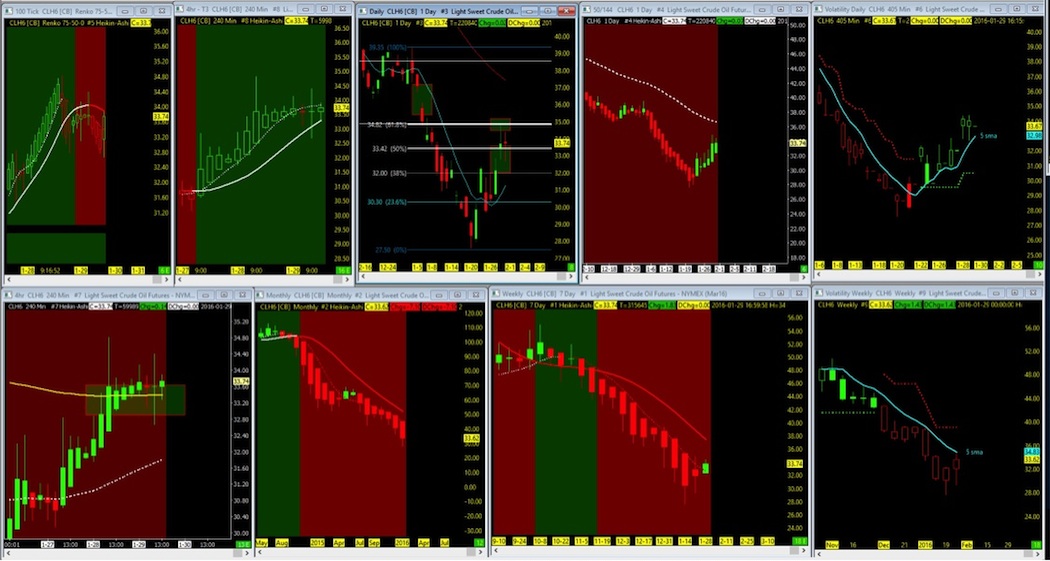
Highlights of the week continue to be the 50/144 ema chart that has guided the bigger trend in conjunction with other chart indicators. Whether it be a downside or upside target of choice, the T3 cross in conjunction with the 50/144 ema continues to be a force to contend with when wanting to remain in the trade for the long term.
Weekly Stock Market Futures Index Recap Focus – VIDEO
The Week Ahead
With the Futures market now rallying to the upside it appears that there may be room to move higher and close out upside open gaps and points of control. By no means does this indicate that the market may not drop back down, so use stops on short-term trades. We continue to close out previous days open gaps below which for the short-term shows a technical bias of support.
For the long term picture, markets clearly remain in a downtrend. The short-term picture has approached a bearish /neutral position on the 4 hour charts to the 144ema which can go either way. Decision time on the rally is likely coming this week. Crude Oil is finding support at the 144ema with no indication of a downturn to continue.
My Technical Bias leading into the first week of February:
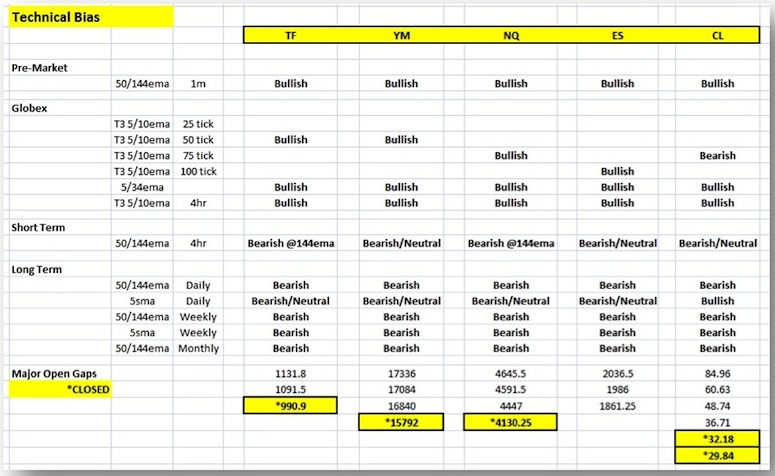
Big Picture Index Charts and Crude
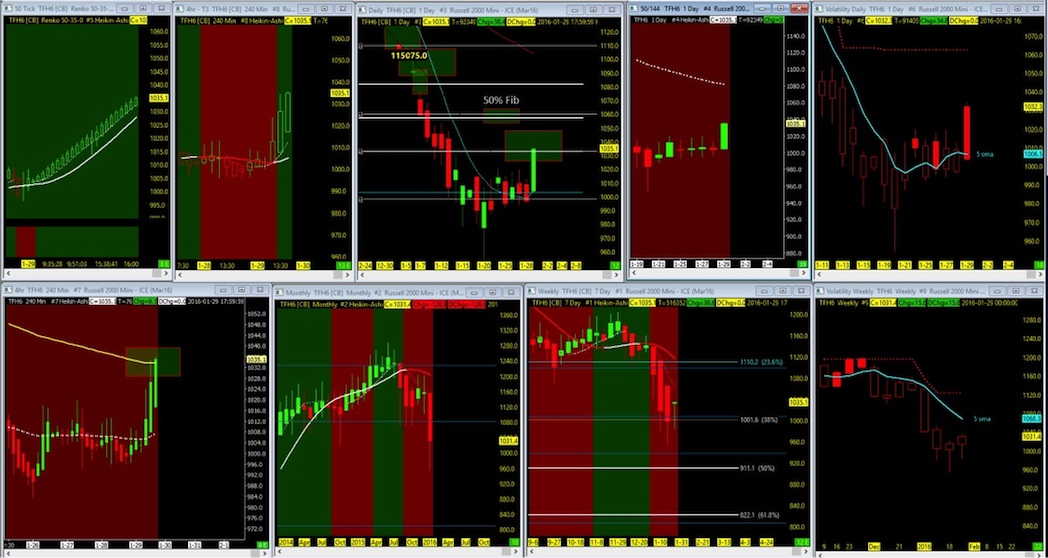
TF – Russell 2000 Futures
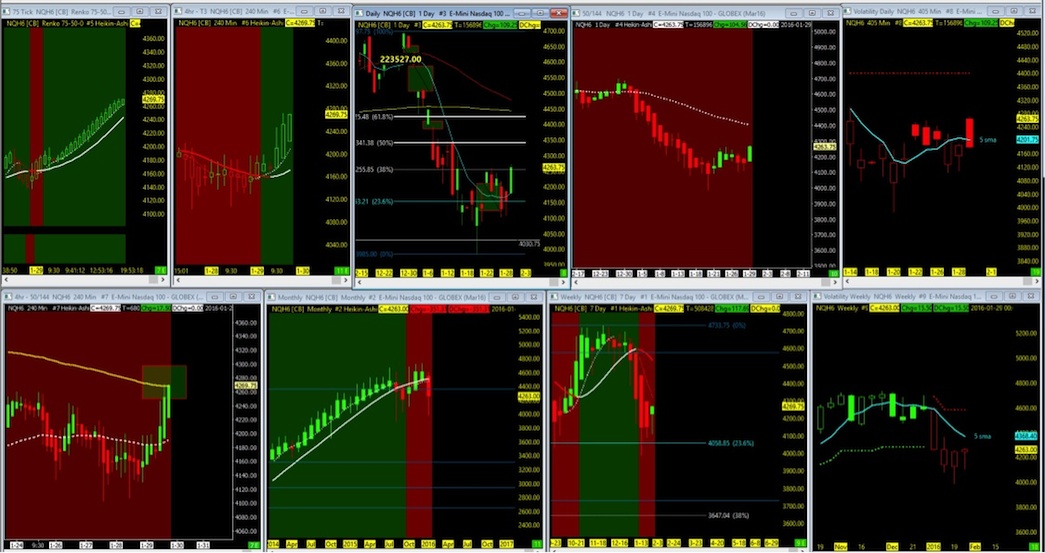
NQ – Nasdaq Futures
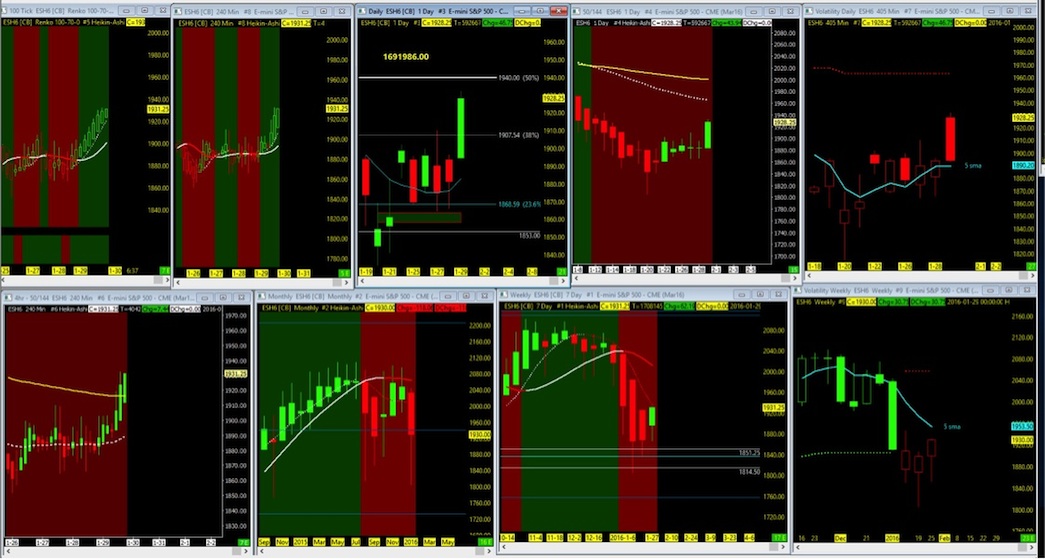
ES – S&P 500 Futures
CL – Crude Oil Futures
It’s been choppy out there so your safest bet with futures markets is to follow the momentum on any given day and keep things tight and short-term, or use higher level indicators and play small ball on longer term position building. We should learn more about the market by week’s end. Until then, always be ready in both directions. Thanks for reading.
Twitter: @TradingFibz
The author trades these indices intraday and may have a position in the mentioned securities at the time of publication. Any opinions expressed herein are solely those of the author, and do not in any way represent the views or opinions of any other person or entity.

: Worrisome to Broader Market?")


