 With the Euro debt crisis at an ebb, a European Central Bank on hold the last few meetings and major oil and gold volatility against the backdrop of a more ambivalent Federal Reserve, the US Dollar (DX) has enjoyed a healthy share of notoriety while the EUR/USD has languished somewhat in the background. But with the latest ECB meeting coming up and gathering anticipation of a rate cut, it’s worth dusting off the EUR/USD (in case you put it away) for a look prior to Thursday’s morning’s rate announcement (7:45 a.m. ET) and ECB President Mario Draghi’s presser (8:30 a.m. ET).
In the near-term, if the ECB comes off more hawkish than expected (this could mean holding rates, backing off another LTRO, or just general jawboning about stabilitee from Draghi himself) the EUR/USD may see a bounce higher: after the steep decline from channel resistance near 1.3830, EUR/USD’s first chance at a solid technical foothold occurs at channel support around 1.3450, in the vicinity of one of the pair’s major medium-term price fulcrums near 1.34.
EUR/USD Analysis – Daily: Rising Channel
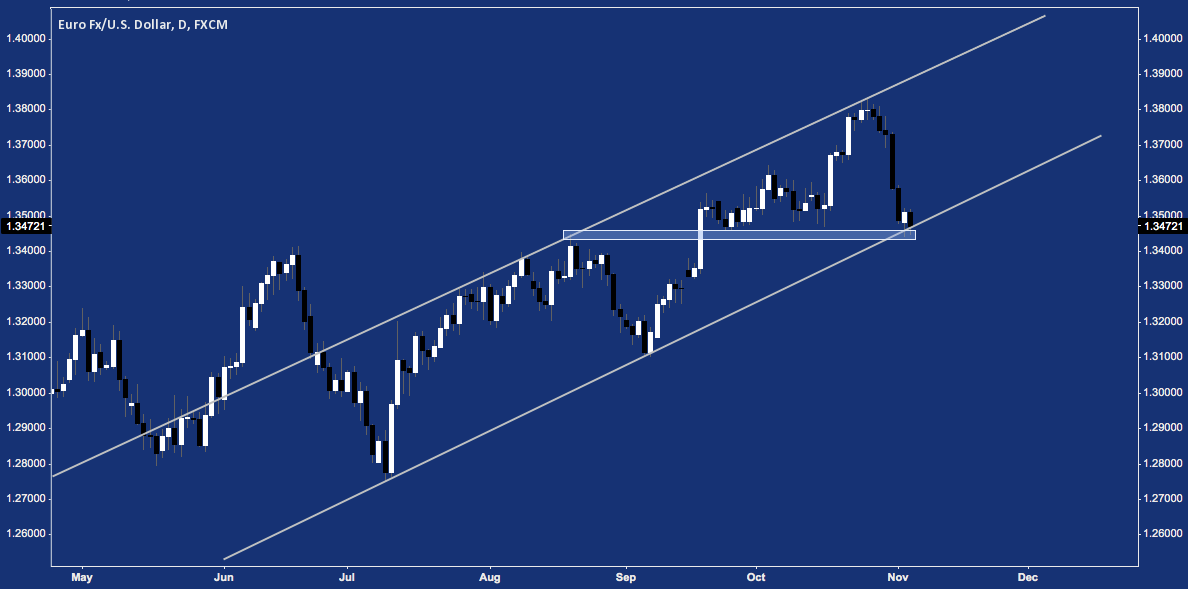
Should 1.34 fail as it has so many times many times over the the last 5 years (see chart below) – this time perhaps with an ECB rate cut as the proximate cause – the next major rung of support comes in at 1.31.
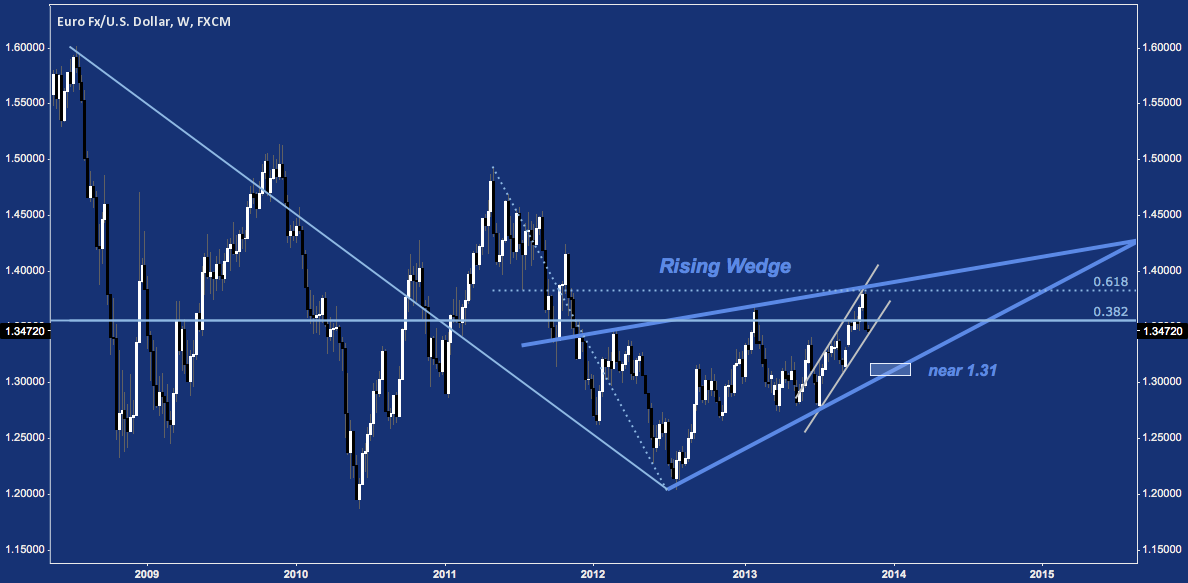
Now consulting the Weekly chart, the possible rising channel bounce at 1.34-1.3450 looks tenuous after just tagging EUR/USD rising wedge resistance near 1.38. The aforementioned 1.31 is the approximate level where rising wedge support touch would occur between now and end of January 2014.
A rising wedge break through 1.31 has multiple major levels of well-established and battle-tested horizontal support to work through, suggesting any measured move down would be an arduous one.
EUR/USD Analysis – Weekly: Rising Wedge
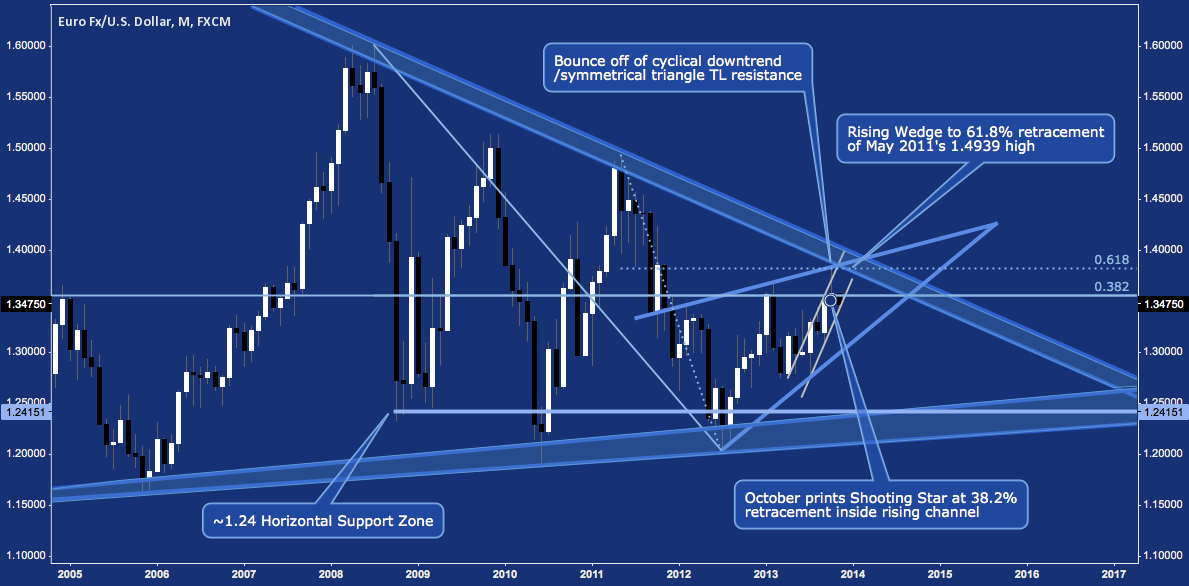
Moving out further to the Monthly chart, we see the rising wedge is pressing higher, into major descending trend line resistance off the 2008 and 2011 swing highs. In this context, we see October’s 1.3831 high comes at the confluence of the rising channel off of July 2013’s low, the intra-wedge 61.8% retracement of the 2011 high and this cyclical descending trend line resistance.
From this high-level view, a 1.31 wedge breakdown looks relatively trivial. Such a move would test between 1.26-1.28 (note October 2012 and April, May and July 2013’s lows) first; and on a fialure there move lower to test the confluence of horizontal and rising cyclical trend line support near 1.24-1.25.
EUR/USD Analysis – Monthly -Multi-Time Frame Confluence
Twitter: @andrewunknown and @seeitmarket
Author holds no exposure to securities mentioned at the time of publication.
Any opinions expressed herein are solely those of the author, and do not in any way represent the views or opinions of any other person or entity.


