 After posting 2013 highs this summer, it’s been all downhill for the US Dollar. A dovish Fed and uncertainty about the “Taper-roo” debacle have continued to apply pressure to the Dollar. But the US Dollar is nearing a support zone that suggests the currency is ready for a bounce… or at least a pause in the drubbing.
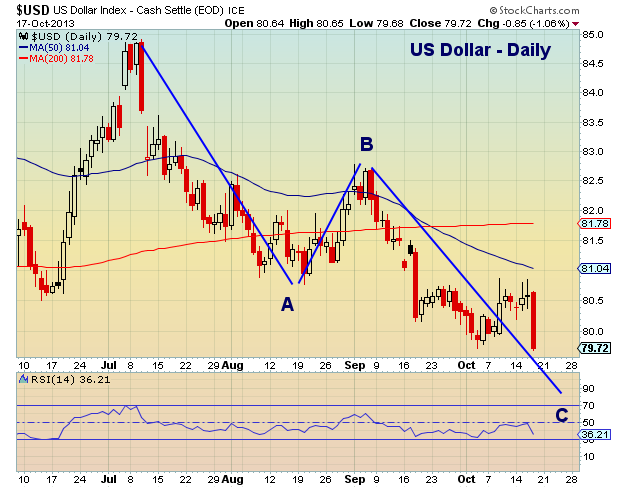
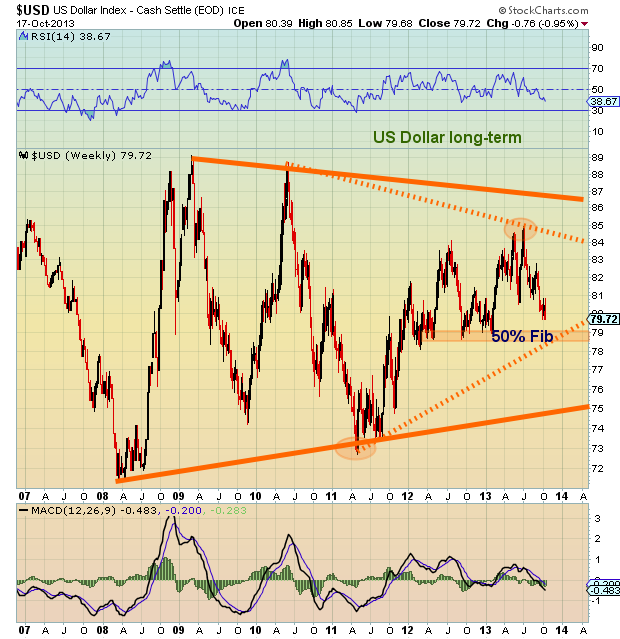
Below are two charts highlighting US Dollar support and resistance on a near-term basis (Daily Chart) and a longer term basis (Weekly Chart). On the daily chart, 78.50-78.75 marks the completion of an A-B-C measured move. It is also the 50 percent Fibonacci retracement of the 2011 to 2013 move higher (see weekly chart).
On a macro basis, this measured move could be a part of a larger measured move, so perhaps the coming bounce will simply be a “B” move, allowing for a “C” move lower that drops the US Dollar to longer term support around 75.
Either way, the coming Dollar bounce should be an impetus for some profit taking in equities. And the Dollar’s short-term bottom may align nicely with Andrew Kassen’s Russell 2000 near-term target as well as the S&P 500’s script-following 4th tag of rising resistance. Keep an eye on how the dollar situation develops, as the character of the bounce will likely hint at what’s in store for equities. Trade safe, trade disciplined.
US Dollar daily chart
US Dollar – Weekly Chart
Twitter: @andrewnyquist
No position in any of the mentioned securities at the time of publication. Any opinions expressed herein are solely those of the author, and do not in any way represent the views or opinions of any other person or entity.


