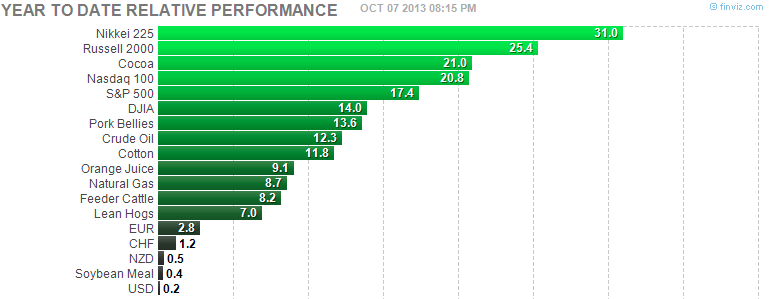
Venezuela’s Caracas General :+272.2%. Argentina’s Merval: +72.5%. Japan’s Nikkei 225: +31% Pakistan’s KSE100: +29.3%. Among Ex-US global equities, some unusual suspects have (wait…Pakistan?) posted blistering year-to-date returns.
The US is no slouch, though. In fact, according to the data linked to above small cap benchmark index Russell 2000 (RUT) comes in just behind Pakistan (there it is again) at +25.4% YTD.
As you can see, even after shedding -1.2% in Monday’s trade, R2k leads broad US equity indices and has radically outperformed non-correlated asset classes year-to-date.
Year-To-Date Relative Performance: Cross-Asset Class Look
In this context, it’s absurd to argue against the premise that “the trend is your friend”: in fact, technicians have had to range far afield into the past lately to find years (1954 and 1995) in which US stock markets have trended with such quiet and abiding strength.
But RUT‘s 2013 return year-to-date (with the S&P 500, NASDAQ 100 and Dow Industrials not far behind) is discomforting precisely because it’s so impressive – all the more so because their fragile splendor is built on precariously-high small cap outperformance.
This discomfiture is no reason to discount a continuation of 2013’s outlying performance; but it does merit consideration of any major obstacles ahead: potential “unbalanced forces” that may signal an end to the Russell 2000’s current state of trend.
To that end, here’s a selection of less conventional charts of the Russell 2000 ranging from 2 months to 20 years, all putting forward the thesis of 1120-1160 as a major technical hurdle to the primary cyclical trend begin in March 2009.
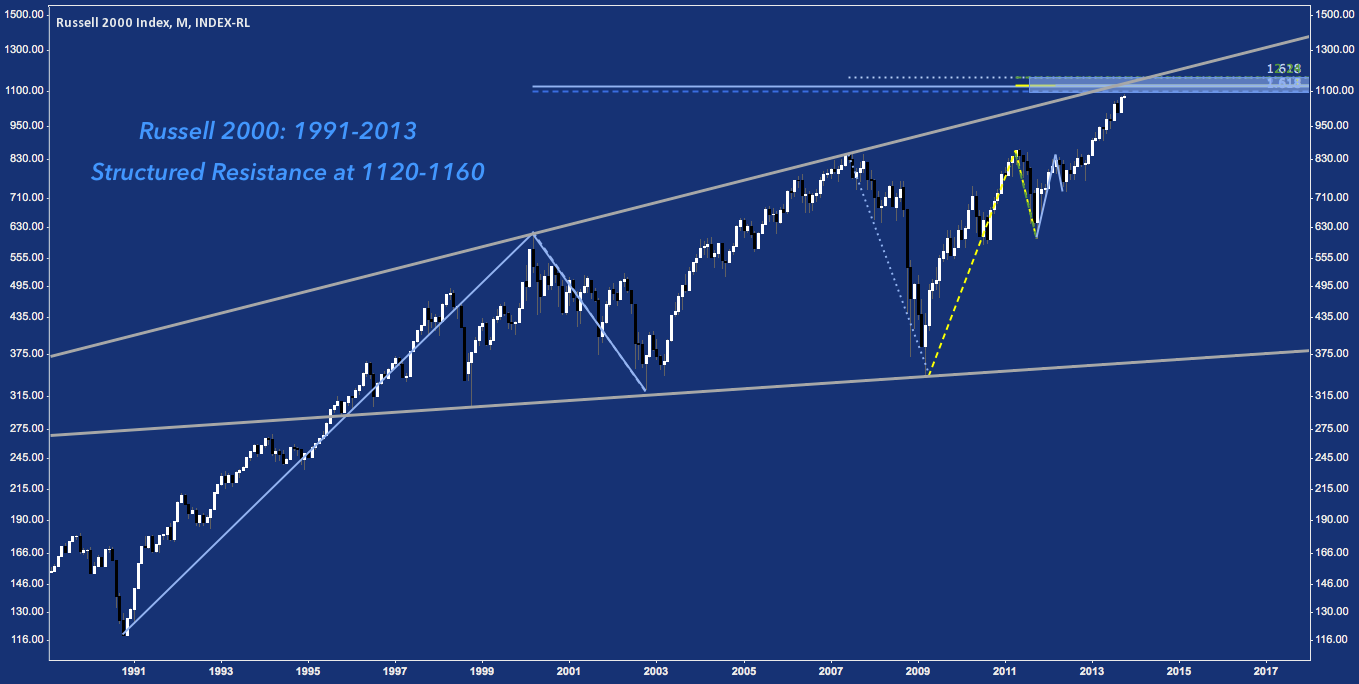
Russell 2000 Chart (RUT) – Monthly Log Chart – Structured Resistance (click image to zoom)
Not only is Russell 2000 approaching Right Angle Ascending Broadening Wedge (RAABF) trend line resistance , it is doing so in confluence with a full measured move off its 1991 low near 120. Additional extensions and projections incorporating 2000-2003’s and 2007-2009 major swing highs and lows complement this measured move through the RAABF to pose a structured resistance field at 1120-1160. There may be a surprise in store, but typically a level so long in formation is not quickly or easily cast aside.
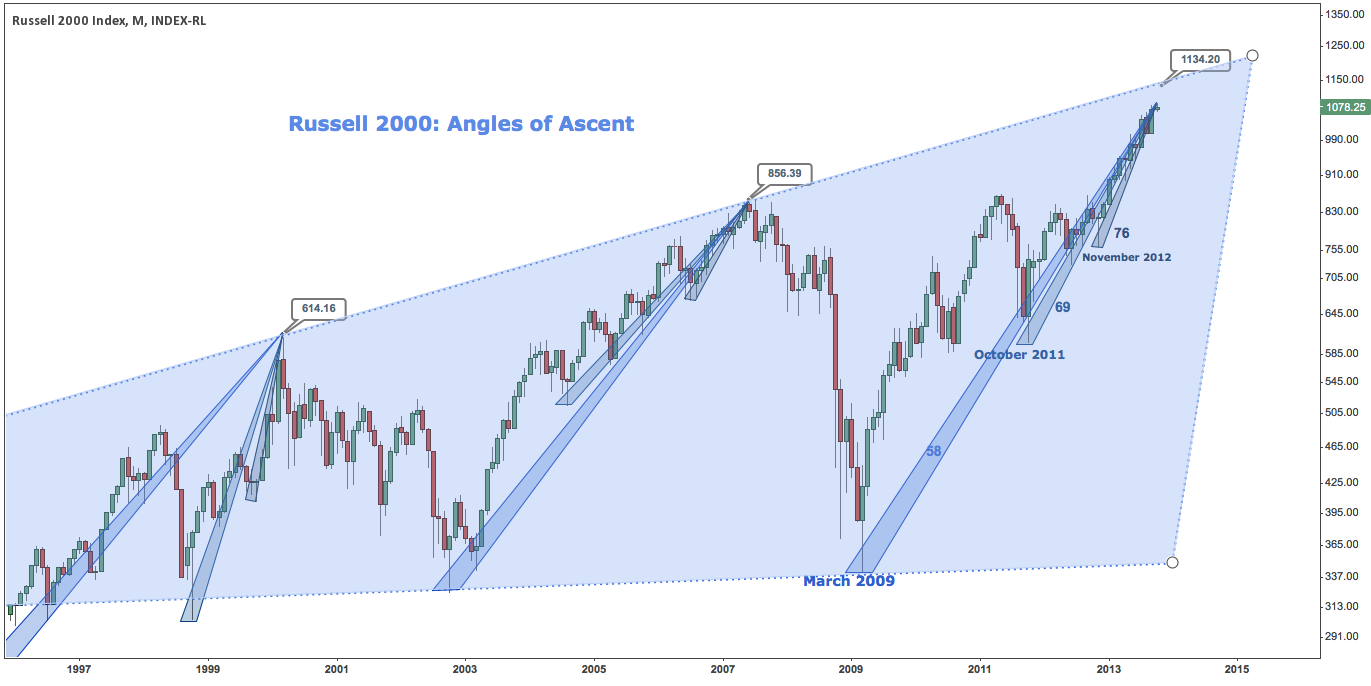
Russell 2000 Chart (RUT) – Monthly – Right Angle Ascending Broadening Formation (RAABF) (click image to zoom)
A variant look at the RAABF, observing Russell 2000‘s steepening angles of ascent as it approach the formation’s diagonal resistance line near 1130-1140.
Russell 2000: Mini Futures (TF) – Monthly: Symmetry (click image to zoom)
Since bottoming in late 2002, this rendering of R2k shows the index working through 5 distinct periods. Periods 1 and 2 make up the impulse legs of a 100% measured move up working from the ’02 low to the ’07 high at trend line resistance. Periods 4 and 5 do the same, ranging from the ’09 low to a ’13 high near 1120 at trend line resistance – ending this month.
These 55 period moves are neatly bisected by a 2007-2009’s 21 (another fibonacci number) period downturn. Momentum as represented by %B (lower panel) has oscillated through several roughly 40 period cycles over this 10 year period.
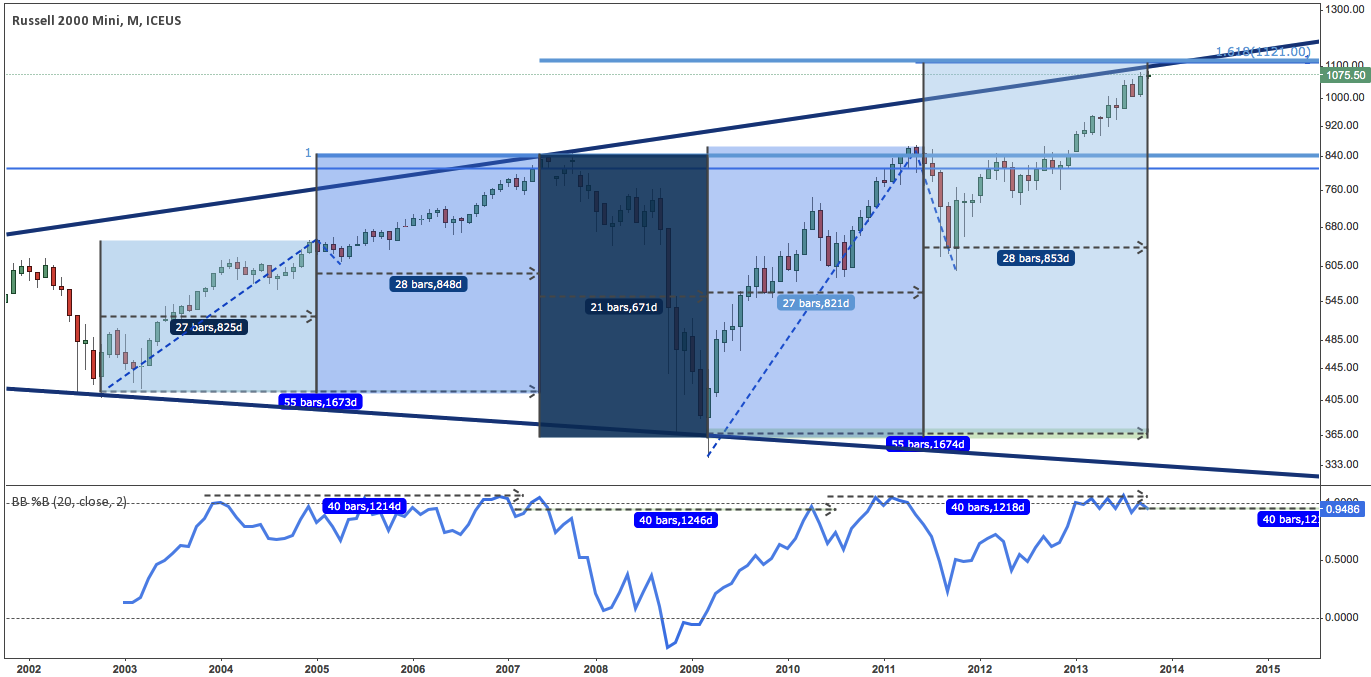
Each different angles on a similar period, these long-term charts illustrate broad but compelling time and price symmetry on the Russell 2000, focusing on the area just above 1100 as a focal point. There’s no demonstrative evidence of a local top yet, much less a cyclical one; but this area just overhead is one deserving close watch.
How does the index get there? The answer may be begin with “moving away” before advancing further.
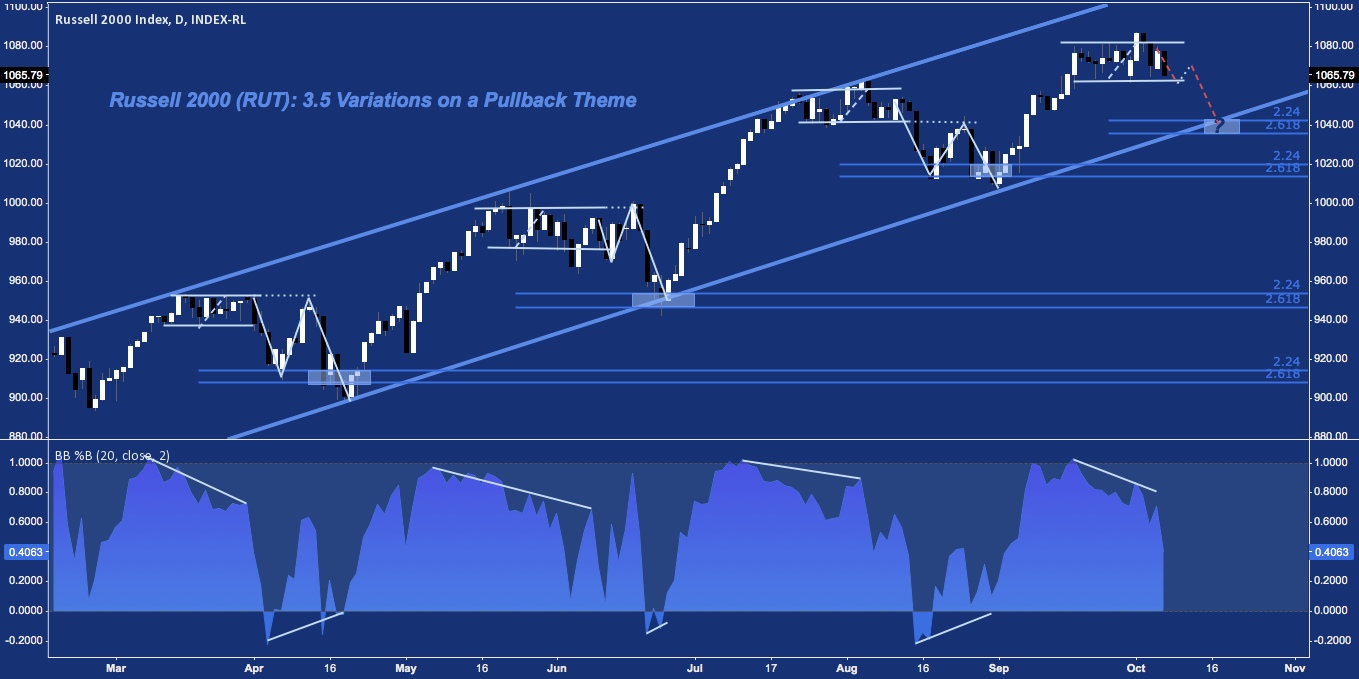
Russell 2000 Chart (IUX/RUT) – Daily: Variations on a Pullback Theme (click image to zoom)
Zooming in to a more immediate timeframe, a familiar theme presents itself: Russell 2000 has spent the balance of 2013 in a strikingly predictable alternation between advance, consolidation, and measured pullback/retracement.
This look sees Three historic examples of this sequence since February. In each case, the consolidation’s range gave way to a 1) breakdown to an initial low; 2) a throwback to consolidation resistance; 3) then breakdown to a subsequent lower low at the 224%-261.8% extension (gray rectangles) of the consolidation. Here, %B (bottom panel) telegraphs the waning upside momentum of the consolidation period with negative divergence; but answers in kind with positive divergence as price digs into the 224-261.8% extension window at channel support.
A fourth example appears to be in the making: if it follows suit, further pullback to channel support near 1035-1040 is probable, over the next several sessions.
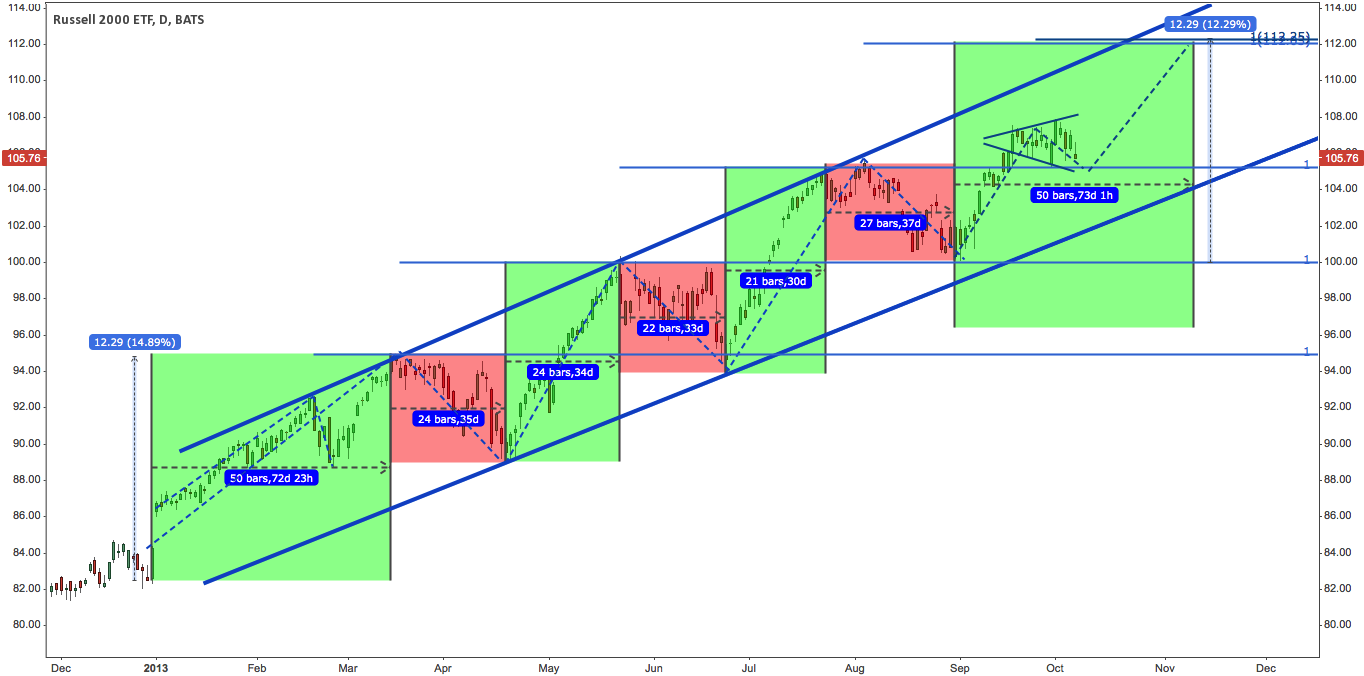
iShares Russell 2000 ETF (IWM) – Daily: 2013’s Rising Channel (click image to zoom)
Viewed in a complementary way on IWM, 2013 has been a sequence of stacking 100% measured moves where the “224-261.8% extension pullbacks” from above are shown as a return to horizontal resistance-turned-support. This careful respect for all-but-identical time and price markets has resulted in the uniform channel-up below.
The current up-leg (far-right green pane) is in broadening formation consolidation, finding support at early August’s 105.50 resistance-turned-support. Assuming this support holds, a measured move from the late August pullback low at 100 projections a target of 112.
Incidentally, the measured move off of the New Year low near 82 that opened the channel squarely resembles a projected move to 112. This move and a test of rising channel trend-line resistance – if they come at all – project over the next 4-5 weeks.
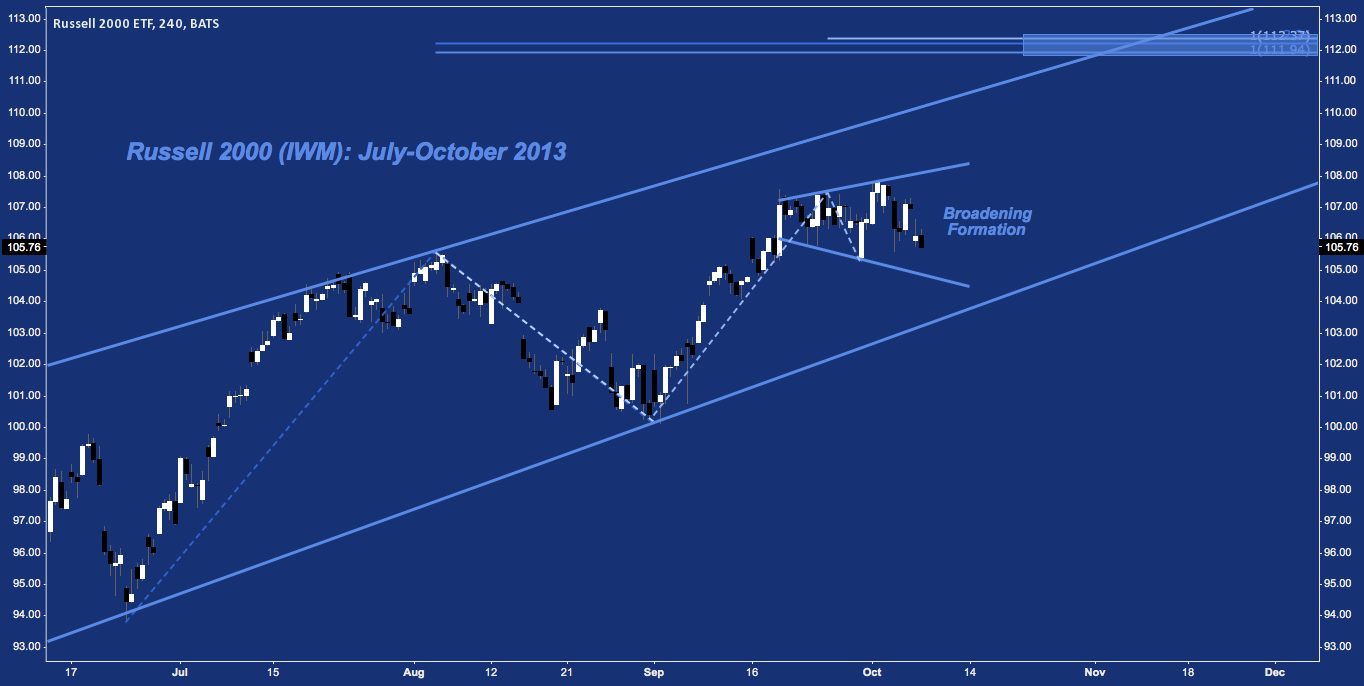
iShares Russell 2000 ETF (IWM) – 4-hour: Measured Move Up (click image to zoom)
Moving in closer on IWM, the final chart focuses on the last 3 panes (green, red, green) above. The measured move off the late August low through the broadening formation is accompanied by a larger MM off the late June low and the 100% extension of the August high-to-low: all intersecting near 112.
Twitter: @andrewunknown and @seeitmarket
Author holds net short Russell 2000 exposure at the time of publication.
Charts courtesy of finviz.com, tradingview.com
Any opinions expressed herein are solely those of the author, and do not in any way represent the views or opinions of any other person or entity.

: Showing Some Signs of Emerging Strength")
