 Recent relative strength in small cap benchmark index Russell 2000 (RUT) has been the subject of much discussion. What does the current small cap stock outperformance v. the S&P 500 (SPX), tell us about capital flows, sentiment, and the health of the current cyclical bull?
The default – and correct – assumption is that this environment is indicative of greater risk appetite. What is all-too-easily forgotten or unnoticed is that this greater risk appetite connotes a greater speculative appetite that often precedes – and indeed, is required to form – cyclical reversals or major secondary reversals in a primary trend.
Russell 2000 (RUT/IUX) v. S&P 500 (SPX) – Monthly: Small Cap Stock Outperformance
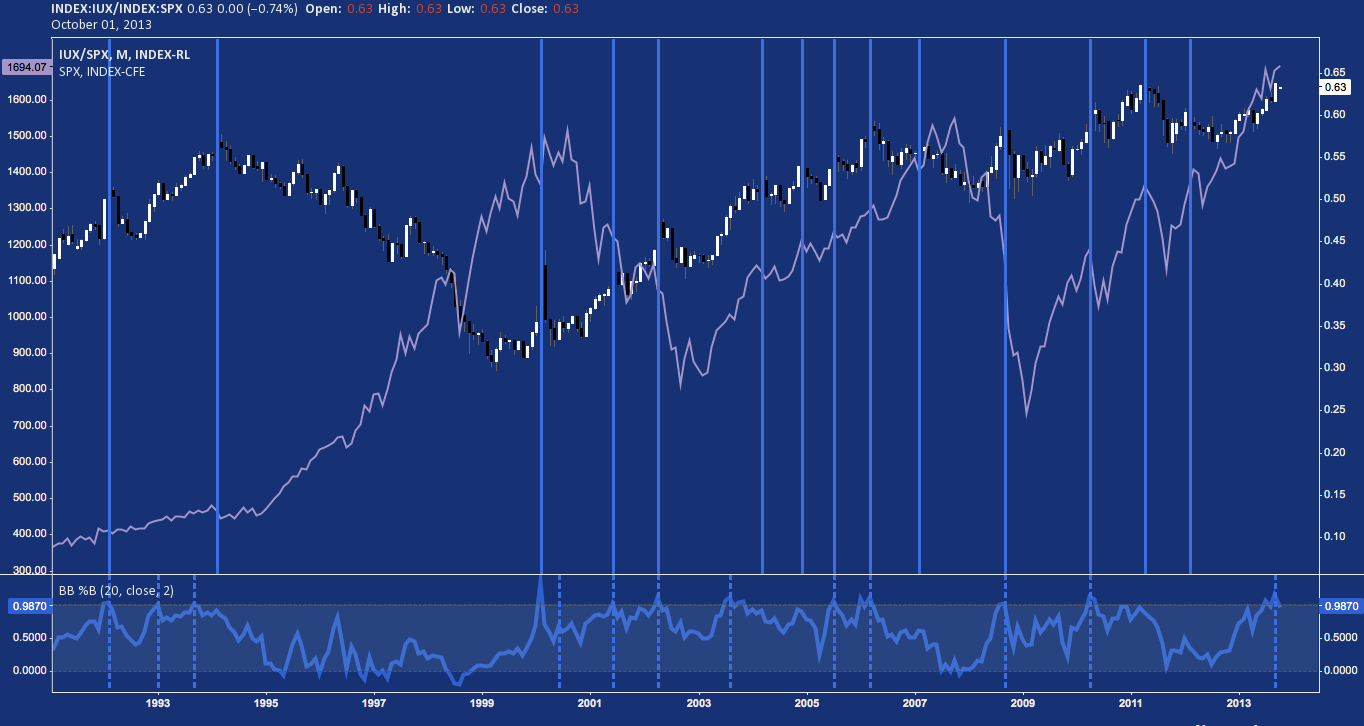
In the case of cyclical reversals, 2000 serves as a prime example. For most of the decade preceding it – really the entire Clinton Administration – S&P 500 companies utterly smashed their smaller Russell 2000-listed peers, performance-wise. Then, at the end of 1999 a radical shift away from large caps into small caps took place – just as equity markets were topping.
This sudden and dramatic small cap stock outperformance was the last gasp of the “irrational exuberance” that characterized the Dot-Com era. Though the S&P 500 didn’t begin to approach its mid-2000 peak during its late 2001 throwback, small cap outperformance did – only to crumble again as large cap stocks began their descent anew.
Small cap stock outperfomance also often precedes large pullbacks, and corrections – secondary reversals – in an intact primary trend. One example of this is in Summer 2011. Here, Small cap stock performance overcame its 2006 highs in early 2011 and then spent a few months making a nominal push higher before rolling over just as the S&P began its 2-month-long, -20% drop.
While we’re on the topic of fashionable market memes – i.e. “Will 2013 end up like 1995?” – take a second look at the 1990s. 1995 was an unbelievable year for equity market performance, along with 1996, 1997, 1998 (with a major caveat), and 1999.
Small caps stock outperformance peaked just before this run in 1994; and once the S&P 500 got over the -10% correction that event precipitated, large caps outperformed until 1999 – when giddy sentiment and irrational capital allocation took off. Small caps did not drive the rally of the latter Nineties: in fact, their role was reduced further and further until just before the market went off the rails.
The less of last 20 years of relative market cap strength: even if large cap relative outperformance is not the cause of corrective and bear market bottoms, it is well-correlated to them; and the inverse applies for small caps.
This market phenomenon isn’t all or even mostly negative, though. Small cap stock outperformance brings excellent opportunities as a function of most mature bull markets; and often characterizes the fantastic – if abruptly concluded – end-run of major legs in those markets.
Remember in the days and weeks ahead; dramatic small cap stock outperformance denotes a heightened propensity for risk-taking. In this environment, capital allocation skews more speculatively to chase the superlative, beta-levered returns small caps have posted.
As the chart above spells out, this enhanced penchant for risk (especially given that short positioning is near record-lows in S&P 500 stocks with just 2.4% out on loan) is not likely to signal a new or early bull market: it is more akin to the unmoored excess – whether at the beginning or end of it – that often precedes sobering corrections and cyclical tops.
Twitter: @andrewunknown and @seeitmarket
Author holds no positions in instruments mentioned at the time of publication.
Any opinions expressed herein are solely those of the author, and do not in any way represent the views or opinions of any other person or entity.

: Showing Some Signs of Emerging Strength")
