Limit your field of vision to equities and all you’ll see is a market benignly plowing higher. Widen it to other asset classes, though, and you’ll notice there’s some significant volatility underway.
Take Crude oil. Slipping further into the red this morning, Light Sweet Crude (CL) is down -16.5% since it’s 2013 peak just above 112 in late August. For reference, over that same period, the S&P 500 (SPX) is up +7.6%.
See It Market Impresario Andy Nyquist put out a note on Crude last Friday, outlining the wide range it’s moving in and speaking without hyperbole about the double-digit percentage losses it has already and could further sustain:
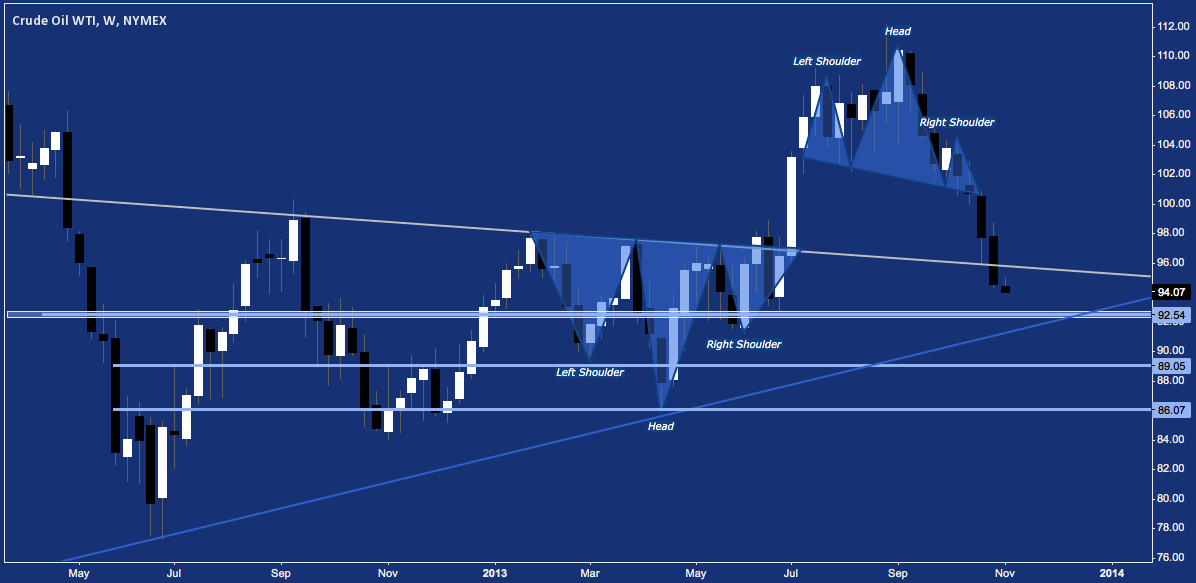
While the 200 DMA [near $98/bbl] holds some psychological weight, I’m more concerned about the recent trend lines at $92, and perhaps $86.
Since then, CL has embarked on another difficult week, putting $92 in close reach and increasing the plausibility of a breakdown into the $80s.
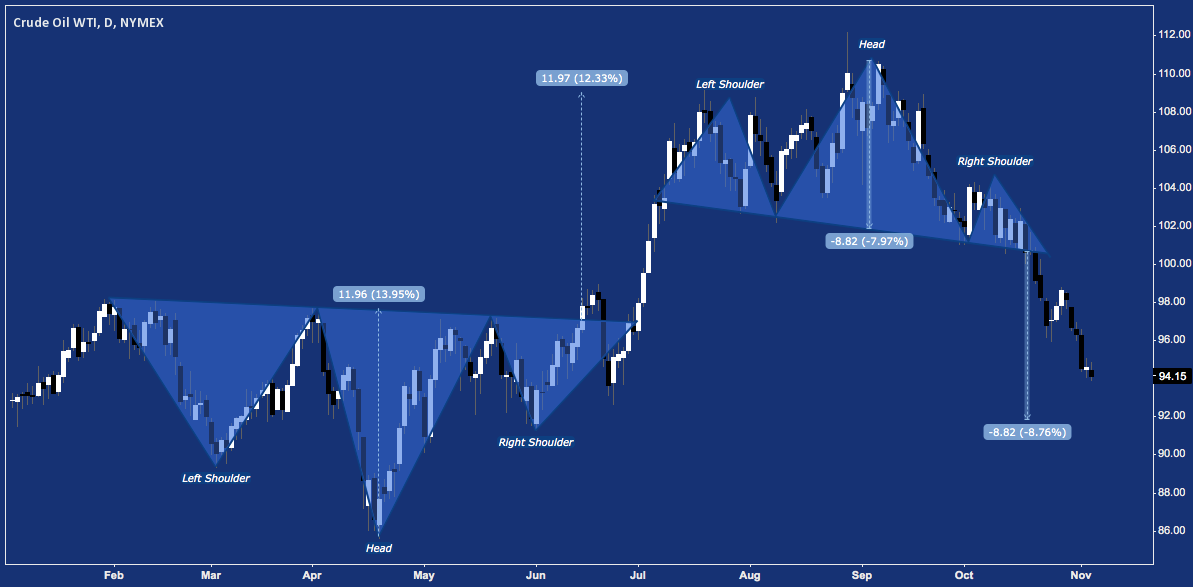
Most immediately, $92 is the measured move target of the July-October Head & Shoulders Top pattern Crude broke dowm from near $101.
Crude Oil Analysis (CL) – Daily: Mirrored Head & Shoulders Patterns
As Andy mentioned in his post, $92 is the also the locus of a major rising trend line. Note the confluence of the H&S top target, the horizontal support-and-resistance fulcrum point, and this rising trend line in the vicinity of $92 between now and January:
Crude Oil Analysis (CL) – Weekly: Support Confluence around $92/bbl
This rapid sub-$100 break down comes in a wider bearish context: that of a Bearish Bat harmonic pattern.
In fact, Crude just finished creating an excellent example of a “special situations” occurrence with harmonic patterns. The Bearish Bat potential reversal zone (PRZ) occurred in the $107-$109 range at point D, below. Crude fought with this level throughout July and August, breaking out and failing in late August, only to close above in early September; but then finally – exhausted – roll over hard a week later.
The “special situations” occurrence here is a PRZ overthrow: a case where a harmonic PRZ creates congestion, is apparently negated by a breakout, only to fail (often at the 100% retracement point, or X) and then decline in a staggered confirmation of the pattern. The attempt to wrestle through D as evoked by back-and-forth of the H&S top and false break often acts as a catalyst for a steeper breakdown once it comes.
Crude Oil Analysis (CL) – Weekly – Bearish Bat Breaking Down
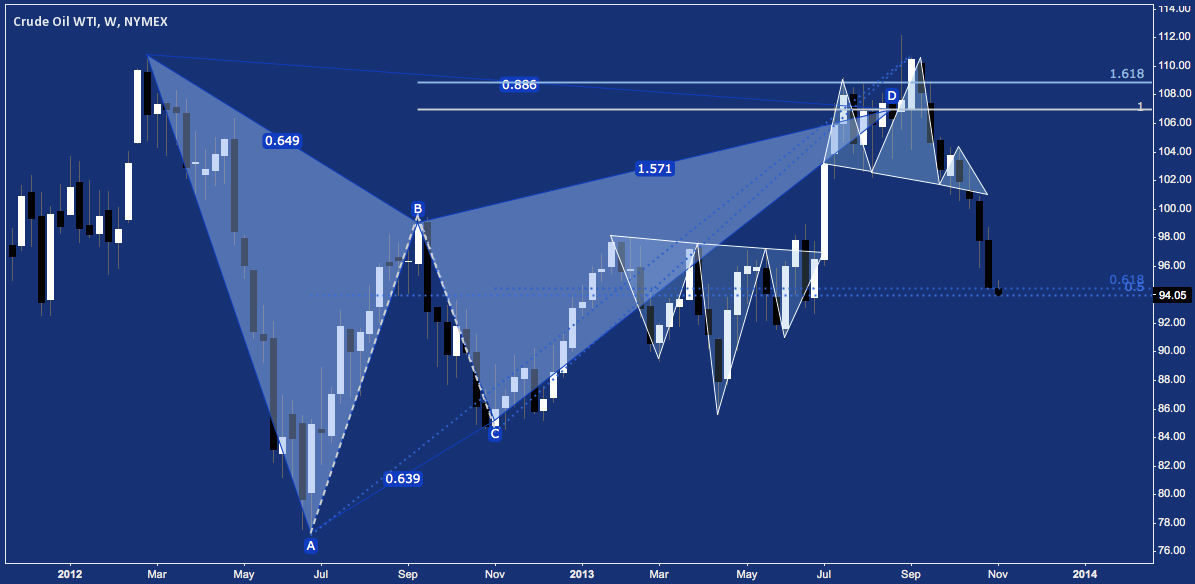
This PRZ overthrow “special situation” wasn’t just the site of a false breakout above a major bearish harmonic pattern; it also meant a breakout failure for the almost 3-year long Symmetrical Triangle pattern that the Bat mostly articulated. Now the 15-month rising trend line Andy noted is just below; with major longer-term implications should it fail.
In fact, with the exception of the cataclysmic days of late 2008, this rising trend line has held since for 12 years, since its first touches in 2001 and 2002 – near $18/barrel.
Crude Oil Analysis (CL) – Monthly: Bearish Bat, Symmetrical Triangle, 12-Year Rising Trend Line
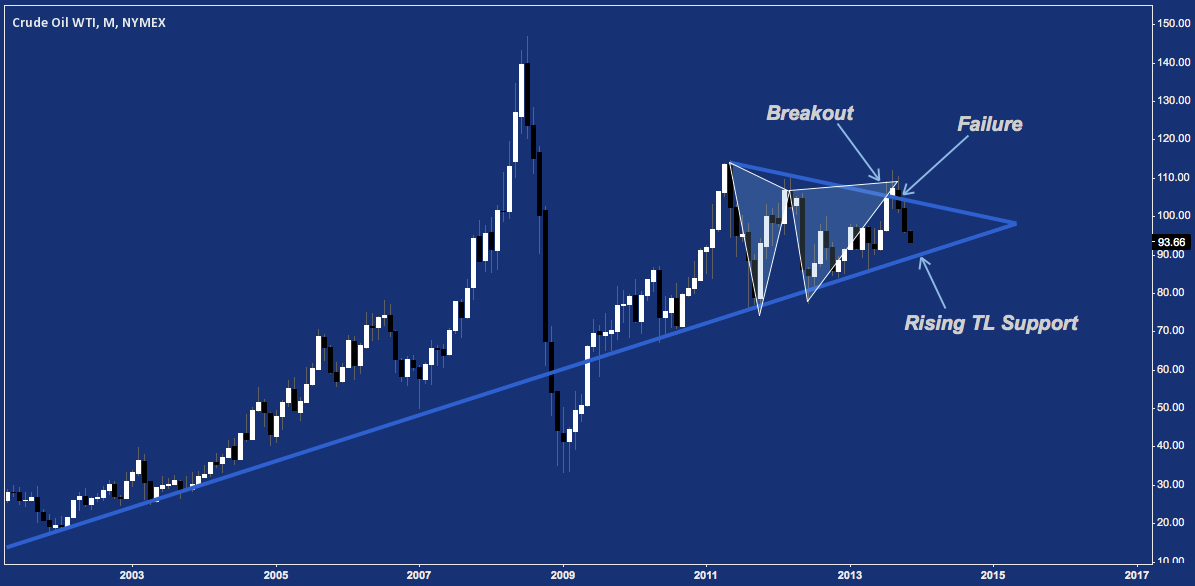
Triangles are a very common technical event – even on this time frame. Oil crashed in 2008, then staged a massive measured move up to recovery its rising trend line and more throughout 2009-2011. Fittingly, the last 2.5 years have seen it tread water (relatively speaking).
If Crude breaks through $92, the triangle it will be breaking down from has left numerous major horizontal support levels that will buffer that decline with demand: $89 and $86 are the most immediate (see their positioning in the second chart down, above). This doesn’t nullify the possibility of a fast break to $80 and below; but does lessen its probability.
With that said, the secular significance of the rising trend line is clear: according to 12 years of precedent this trend line does not break unless it is on a critical market shift a la 2008. Equities are clearly enjoying a 1995-like outlier year, so why can’t Crude cavort around at the bell-curve tail-end party as well with a break of this rising trend line?
Perhaps its will; but it’s worth remembering anticipation of a break there has been a fool’s errand – except that time when the world was ending.
Twitter: @andrewunknown and @seeitmarket
Author holds no exposure to securities mentioned at the time of publication.
Oil barrel image sourced from https://www.energybook.info
Any opinions expressed herein are solely those of the author, and do not in any way represent the views or opinions of any other person or entity.

: Showing Some Signs of Emerging Strength")
