 Gold just finished off Q3 2013 in broad consolidation of the sweeping ranges and massive drops that characterized (terrorized?) 2013’s first half.
No stranger to irony, volatility in the yellow metal has now subsided to one of its lowest points this year, quite in contrast to broad expectations of what would follow September’s FOMC meeting.
Now the lack of movement begs the question: could we see Gold put in a repeat performance by installing some big moves into the close of 2013?
To answer this: let’s look at the commodity’s current technical balance; and how the leading bearish and bullish directional scenarios might unfold.
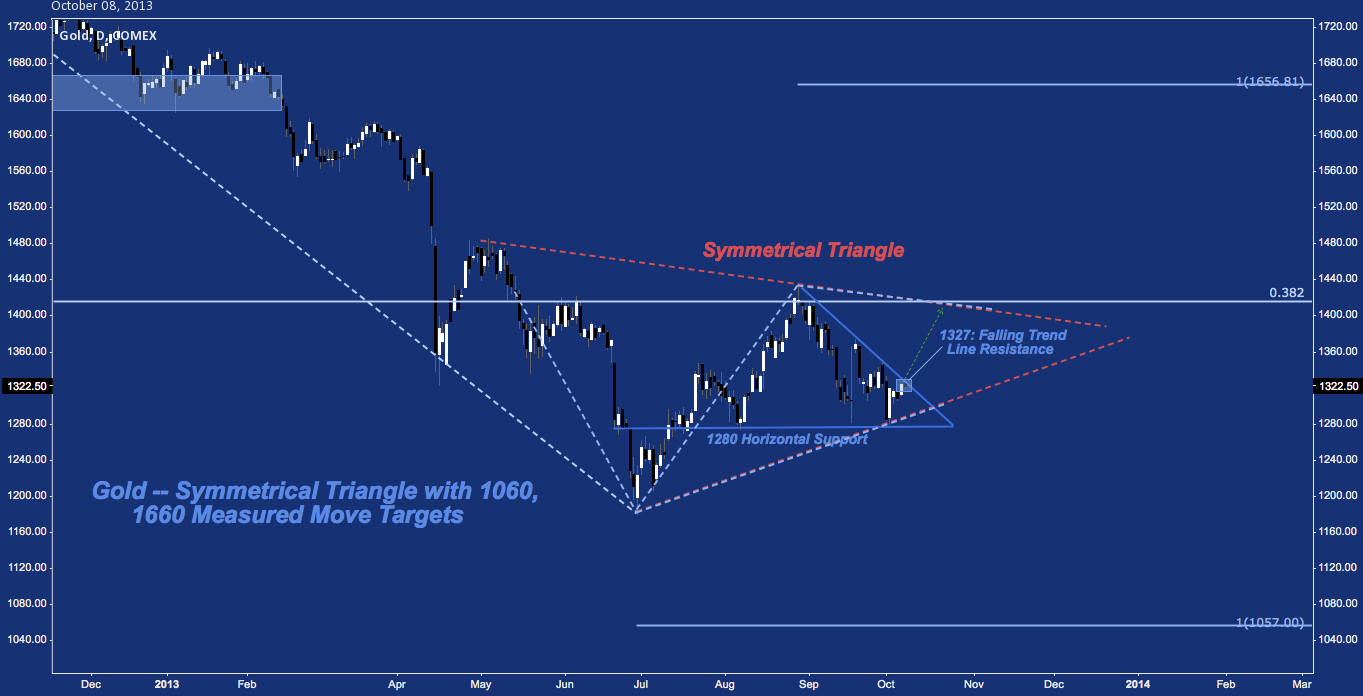
Gold Analysis (Futures: GC) — Daily: Symmetrical Triangle (click image to zoom)
The tightening back-and-forth between 1200 and 1500 that occurred in the so-callecd “barbarous relic” between Q2 and Q3 has created a wide symmetrical triangle with significant directional implications, targeting full measured moves of 1060 or 1660.
Less ambitiously, taking a look at the oscillations inside the triangle a local down trend from late August-October from 1410 to 1280 is present. Following the bounce several sessions ago at 1280, the falling trend line defining this trend is now under threat.
A break above this level opens a path back to triangle resistance near 1400. Alternatively, a failure at 1280 support carries more ominous tones, occurring simultaneously with a break of symmetrical triangle support. Horizontal support then comes in at June’s low near 1200 before the floor opens up to 1060.
What could a bearish resolution to this triangle look like?
Gold Analysis (GC) — Daily: Head & Shoulders Top (click image to zoom)
Looking more closely at the activity inside Gold’s symmetrical triangle since June, we discover a uniform Head & Shoulders Top pattern comprised of the July, August, and September swing highs, each of which have treated 1280 as subsequent horizontal support. If Gold breaks its 1280 neckline (coinciding with the symmetrical triangle support break mentioned above), a similarly bearish scenario applies. Here, horizontal support comes in at June’s low near 1200, followed by the H&S Top’s measured move target at 1110-1125.
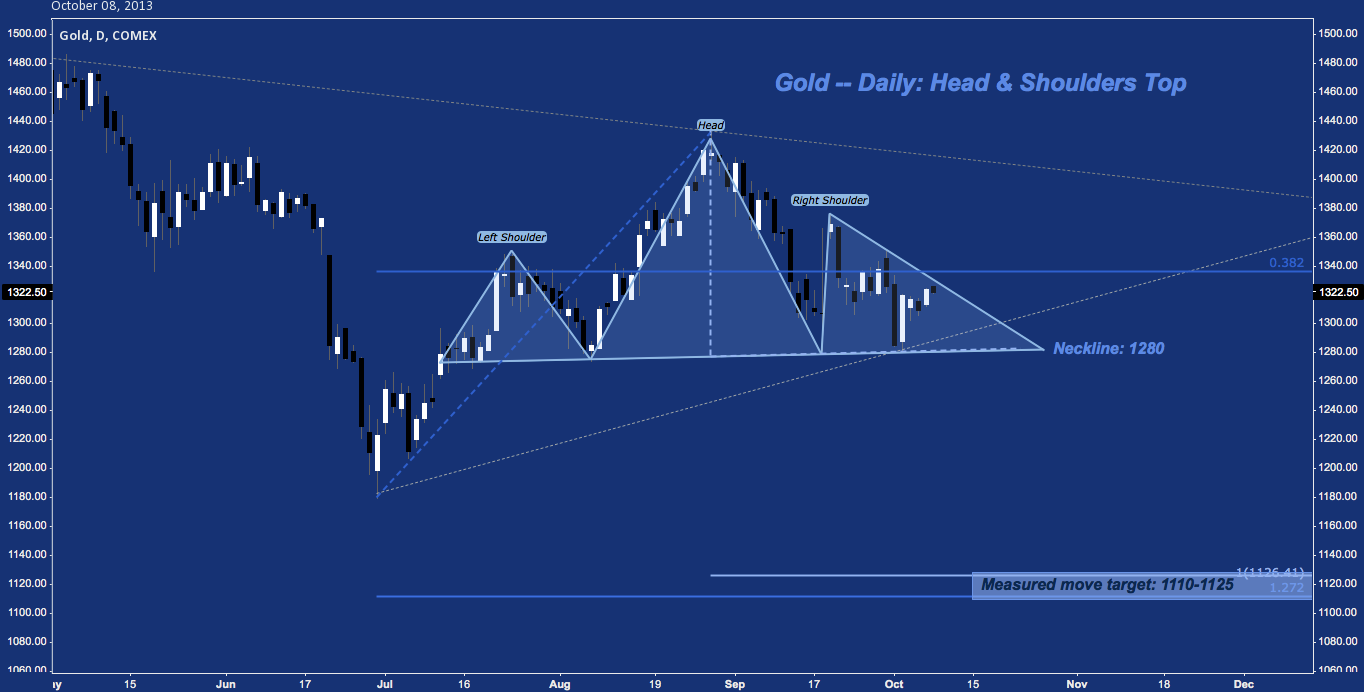
Though this target isn’t coincident with the symmetrical triangle’s bearish projection (which often go unattained), it goes a long toward tagging it.
A roughly 15% down move? That’s evocative of the first half of 2013.
Having laid out a bearish case, how might a plauusible bullish resolution to the symmetrical triangle go?
Gold Analysis (GC) — Daily: Butterflies (click image to zoom)
A quick technical trick: nearly all (if not all) true symmetrical triangles (defined as “two converging lines comprised of least 4 total touches, featuring a lower high and high low on the most recent set”) are also the first 4 points of a harmonic pattern.
In the case of gold, the construction of the symmetrical triangle present is laying out a Bearish Butterfly, two variations of which are drawn below.
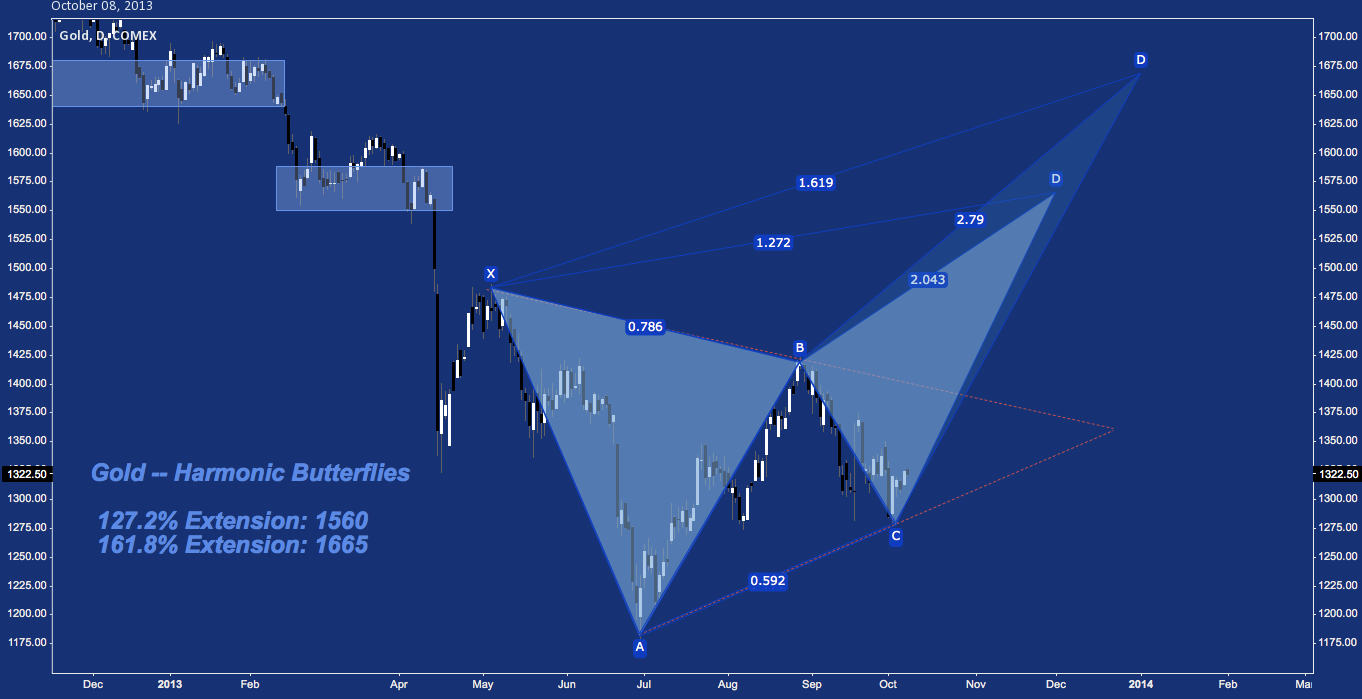
But isn’t this the bullish outcome? Yes, for the immediate-term (i.e. Q4 2013). From present levels, formation of the Butterfly requires upside break out of the symmetrical triangle and reaching one of two fibonacci extension targets: 127.2% XA occurs at D (light blue) near 1560; 161.8% XA occurs at D (dark blue) near 1665.
As we discussed above, the symmetrical triangle’s potential upside extends to 1660, in confluence with the higher point D at 1665. Looking left, notice that both extension points plot at significant medium-term congestion levels last visited in early 2013.
Speaking of the medium-term, Bearish Butterflies are just that. Their construction is generally bullish; but once it completes – here at 1560 or possibly 1675 – at its Potential Reversal Zone (PRZ), the objective of the pattern is bearish. Because of this, the bullish Butterfly premise of 1560 or 1675 carries the suggestion of a bearish turn further out, probably into Q1-Q2 of next year.
Twitter: @andrewunknown and @seeitmarket
Author holds no position instruments or securities mentioned at the time of publication.
Charts courtesy of tradingview.com
Any opinions expressed herein are solely those of the author, and do not in any way represent the views or opinions of any other person or entity.

: Important Breakout Retest")


