The number of stocks making new lows just saw a huge spike, especially considering the major indexes remain within arm’s length of their 52-week high.
As we mentioned yesterday, the drop in stocks to begin the week has really shaken things up in the market. It’s not that the decline has been that large. Rather, the relentless rally of late had conditioned investors in a way such that the moderate losses of the past 2 days served as a bit of a shock. And from the potential over-reaction by volatility traders to the profusion of both new highs and new lows on the NYSE on Monday, we are seeing some interesting developments in response.
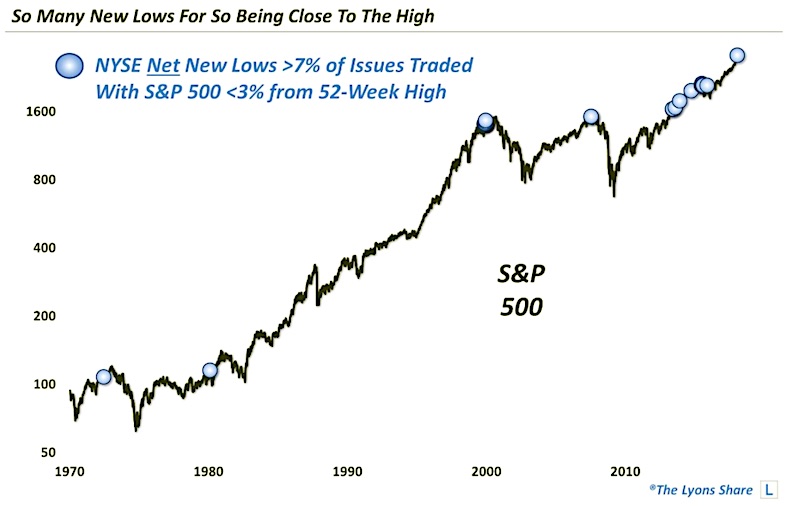
Yesterday brought another odd development among the new highs/new lows on the NYSE as we note in today’s Chart Of The Day.
To wit: yesterday’s drop in the S&P 500 (SPX) still left the index just 1.76% away from its 52-week (and all-time) high. Despite that, we saw 271 stocks on the NYSE closed at a 52-week low versus just 44 new highs. The net difference of 227 more new lows than new highs represented 7.4% of all stocks traded on the NYSE. If you think that sounds like a lot, you’re right.
ALSO READ: Household Stock Ownership At Highest Level Since 2000
Since 1970, the S&P 500 has closed within 2% of its 52-week high on more than 4500 days. This is just the 15th time on such days that the number of net new lows totaled more than 7% of all stocks trading on the NYSE. Loosening the parameters a little to include all days within 3% of a SPX 52-week high, the chart below shows that yesterday was just the 30th time that NYSE net new lows represented more than 7% of all issues traded.
Glancing at the chart above, it’s apparent that several of the previous 14 occurrences came at rather inauspicious times, including near cyclical tops in 1972, 2000 and 2007. However, there were also times in the past half decade that didn’t inflict much if any damage on the market. So is this “lowly” condition really something to worry about?
Over at The Lyons Share, I take a deeper quantitative dive into the historical precedents to determine the likely impact of the current signal. Check it out if interested.
Twitter: @JLyonsFundMgmt
The author may have a position in mentioned securities at the time of publication. Any opinions expressed herein are solely those of the author, and do not in any way represent the views or opinions of any other person or entity.

: Showing Some Signs of Emerging Strength")

