 After ending 2012 in style, the Emerging Markets lost steam and began a multi week pullback to its trend line. In fact, in early January I cautioned readers on a potential Emerging Markets (EEM) change in character. For many investors, this has been frustrating. Lots of cheap money and a late year run higher had raised hopes… but the Emerging Markets have been cast aside for U.S. Equities. And this has likely added to the frustration.
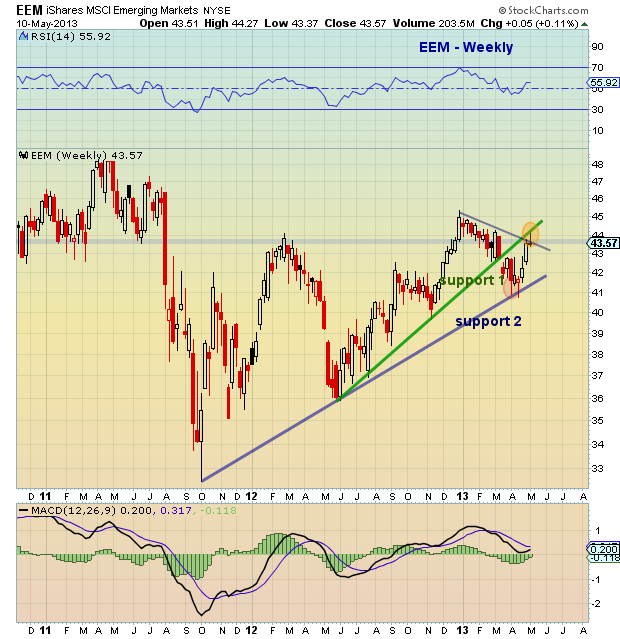
But in recent weeks, the Emerging Markets ETF (EEM) has battle back. Looking at the weekly chart below, it’s fortunate that the multi-week pullback didn’t do more technical damage. Although the June 2012 uptrend (support 1) was broken, the longer term trend from October 2o11 (support 2) held nicely and the ensuing lift has been brought the Emerging Markets back to life. The latest lift saw the recent weekly candlestick break above the downtrend line; however, one caveat: EEM closed back on/below that line. As well, this past week’s candle stick left a long wick, pushing up all the way to fully backtest the broken June 2012 uptrend support (1).
So where does that leave the Emerging Markets? Well, that long wick candle is concerning, so it may be wise to wait for a move back above last week’s highs. It would also be good if EEM can retake and hold above the downtrend line. On the downside, keep an eye on the longer-term rising uptrend (support 2) – that needs to stay in tact.
Thanks for reading. Trade safe, trade disciplined.
Twitter: @andrewnyquist and @seeitmarket
No position in any of the mentioned securities at the time of publication.
Please check us out on Alexa and feel free to provide a review with feedback.


 Flirting With Critical Support… Again")
