The difference between how investors price UST 2 versus UST 10 help us contrast expectationsfor economic growth/inflation and monetary policy. When the curve inverts, the market is warning us that the Fed’s monetary policy is restrictive or in market terms, tight or hawkish. In such an environment banks are not very willing to lend as their cost of borrowing does not provide enough profit margin to cover credit losses and meet profit thresholds. Conversely, when the curve spread is wide and monetary policy is deemed easy or dovish, banks are in a much better position to extend credit.
While there are many explanations for why the curve is flattening rapidly, the consensus seems to be that inflation and the long-term economic growth outlook for the future are benign despite a recent spurt in economic activity. In fact, the Fed’s long-term projected rate of economic growth is only 1.90%. Fed Funds are currently 1.75-2.00% and expected to increase at least two or three more times. The combination of views necessarily flattens the yield curve and importantly makes lending less profitable.
The New Curve
What if your local weatherman forecasted weather not based on atmospheric conditions and other scientific data but instead on his own forecast. “I dreamt it will rain in three days, therefore my forecast is for rain in three days.” His prediction method, if uncovered, would probably lead him to seek a new career.
The weatherman’s forecast is a good way to describe the new yield curve the Fed has recently publicized. This curve is calculated by comparing the current three-month rate for Treasuries versus what that rate is expected to be six quarters from now. The forward rate is calculated using the current rate and the interpolated rate on 1.50- and 1.75-year Treasury notes. Do not get caught up in the complexity of the math but in laymen’s terms the curve is simply a forecast of what the market thinks the Fed will do. Let that bit of recursive logic resonate before reading on.
Said differently, the Fed imposes unnatural control over the shape of the new curve. Consider again the correlation table above. For Treasury securities with two years to maturity or less, expected Fed policy has a strong influence on yield. Therefore, by saying they intend to hike interest rates, the Fed also influences the shape of their new yield curve metric. The logic behind the new curve logic confounds what they claim is a pure insight into expectations for a recession.
The Fed is not coy about making that clear as witnessed in the most recent FOMC minutes – The staff noted that this measure (new yield curve) may be less affected by many of the factors that have contributed to the flattening of the yield curve, such as depressed term premiums at longer horizons.
The following link provides more information on their new curve.
Comparing Curves
The following graph compares the traditional 2s-10s curve and the new curve with recessionary periods represented by gray bars.
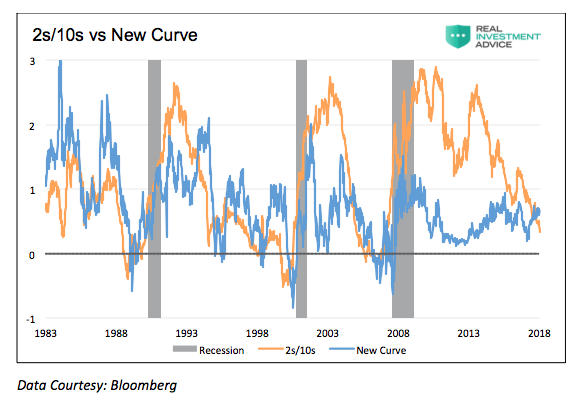
As shown above, the orange line representing the traditional curve and the new curve in blue are well correlated and have both dependably warned of recession about a year or two before the beginning of previous recessions.
Closer inspection of the last six years, as shown below, however, yields a very different story.
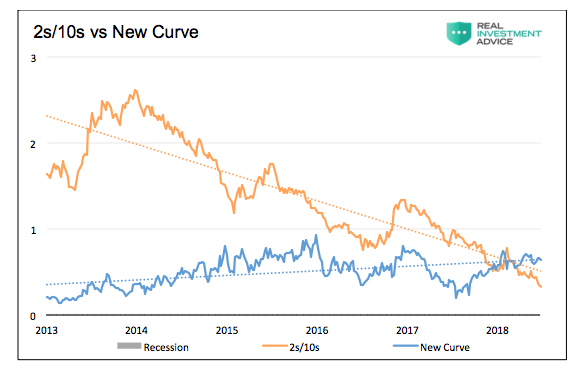
The traditional 2s-10s curve spread is falling at a decent pace and has been in decline for the better part of the last five years. Conversely, the new curve has been in a slight uptrend over the same period. Clearly, the curves are sending different messages.
Calling Foul on the Fed
There is one key difference between the two curves that is vital to appreciate. The Fed has much more control over the shape of the new curve versus the traditional curve. For instance, if the Fed promises more rate increases and continues to deliver on said promises, there is a high likelihood the new curve will stay positively sloped. The traditional curve, as shown earlier, is much less influenced by the Fed directly. Instead, it is quite likely the traditional curve, in that situation, would continue to flatten and invert as further rate hikes are thought to have a dampening effect on economic growth and inflation. Per the Federal Reserve –“Periods with an inverted yield curve are reliably followed by economic slowdowns and almost always by a recession.”
We believe the Fed is introducing this new curve to provide cover to allow them to keep raising rates. The trend and impending signal from the traditional curve is leading investors to second guess the Fed and their tightening campaign. The traditional curve could cause investors to lose confidence in the Fed. Given the state of excessive asset valuations built largely on confidence in the Fed, this presents a big problem. If, on the other hand, investors buy into the new curve and its upward sloping shape, might they be persuaded a recession is not in sight and their confidence in the Fed will remain strong?
It’s important to remind you why the Fed may be particularly anxious about raising rates. During the last two recessions Fed Funds reductions of 5.25% and 5.50% were required to stabilize the economy. Additionally, in 2008/09 the 5.25% rate cut wasn’t enough, and the Fed introduced QE which quintupled the size of their balance sheet. With Fed funds currently at 1.75-2.00%, the Fed has much less ability to stimulate the economy if economic growth were to slow.
Summary
In baseball, .200 is the line in the sand. It is widely accepted and understandably so given over 150 seasons of baseball. In economics, a flat or inverted 2s/10s yield curve is the line in the sand. It is widely accepted and its validity is broadly discussed in prior Fed research. Changing the Mendoza line to say .150% would allow some current substandard players to achieve “professional grade,” but the quality of players would remain the same. Likewise, changing the markets recession warning may change the perspective of some investors but will it nullify a recession?
The Fed may not like the market’s perceptions and implications of a flatter yield curve but changing it to one of their liking is not likely to alter reality. Importantly, if the goal of the current Fed is to convey a message that allows them to raise rates further, they may have found a good alternative. Our question is, however, in the name of transparency, why not just say that is the objective rather than sacrifice integrity?
Regardless of whether the Fed’s version of the economic Mendoza Line changes, we simply urge caution based on the signals of the traditional curve. Redefining key measurements of economic conditions may alter the eventuality of a recession but it will not make long-term expansions or contractions in the economy any more or less likely. It will only confuse and conflict Fed members charged with dispensing prudent policy.
We leave you with recent thoughts from the Federal Reserve on the value of the traditional 2s/10s yield curve: “Forecasting future economic developments is a tricky business, but the term spread (traditional 2s/10s yield curve) has a strikingly accurate record for forecasting recessions. Periods with an inverted yield curve are reliably followed by economic slowdowns and almost always by a recession.” – March 2018 Economic Forecasts with the Yield Curve Federal Reserve of San Francisco.
Twitter: @michaellebowitz
Any opinions expressed herein are solely those of the author, and do not in any way represent the views or opinions of any other person or entity.


