In general, the broad stock market has held up much better than one would think, all things pandemic considered.
One industry that continues to amaze me is the Transportation sector. New all-time highs with economic uncertainty and less passengers on planes in the air and in cars on the road.
But that’s precisely why we follow price!
Today, we take a quick look at a chart of the Dow Jones Transportation Average, highlighting the potential of a repeating pattern… or possibly an immediate breakout. One way or the other, we should know which one outcome or the other in the days ahead.
Note that the following MarketSmith charts are built with Investors Business Daily’s product suite.
I am an Investors Business Daily (IBD) partner and promote the use of their products. The entire platform offers a good mix of technical and fundamental data and education.
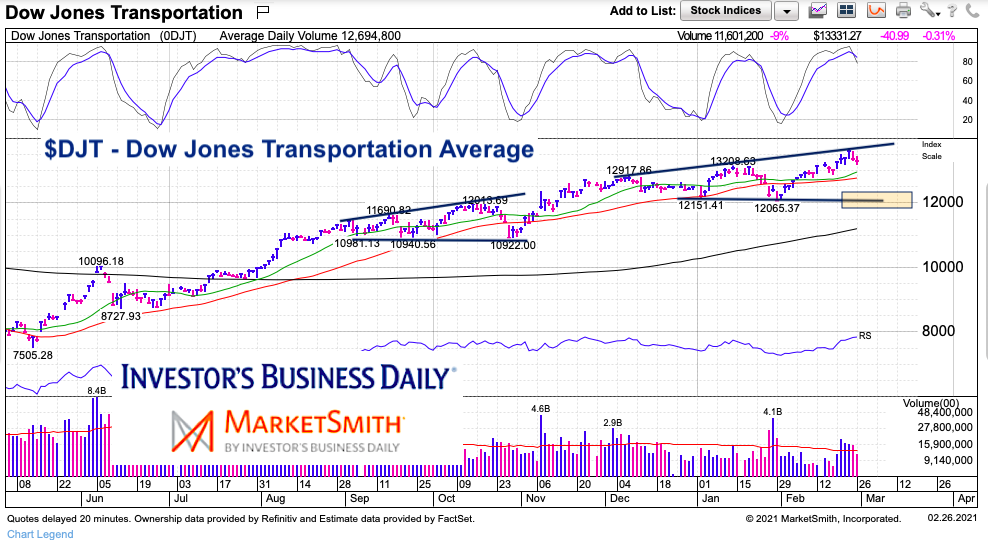
Dow Jones Transportation Average “daily” Chart
Pretty simple chart here. As you can see, the Transports made new highs last fall but returned to its “base” a couple more times before heading higher. A similar pattern is emerging right now. So will the Transports simply breakout… or head lower for another dance with support? Stay tuned. We should know soon enough!
Twitter: @andrewnyquist
The author may have a position in mentioned securities at the time of publication. Any opinions expressed herein are solely those of the author, and do not in any way represent the views or opinions of any other person or entity.

: Showing Some Signs of Emerging Strength")

