With Crude Oil prices having bounced sharply from our support targets, there’s strong evidence that the large downward move in oil prices may be complete. Looking forward, we do not expect prices to soar to 2013 levels, but traders can probably catch good moves in the coming weeks and months with an upward bias (assuming the lows hold). The charts below show how a bottom may have formed in the futures market, as well as where prices may be headed for the United States Oil Fund ETF (USO).
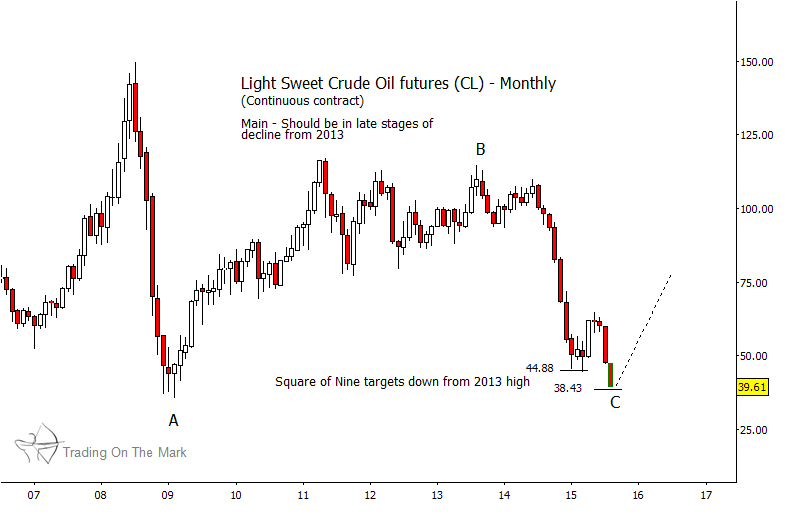
On a monthly chart, we see that oil futures may have completed a large A-B-C corrective pattern down from last decade’s high. Crude Oil prices reached and recognized our big-picture support price targets at $44.88 and $38.43.
Crude Oil Prices (futures) Monthly Chart
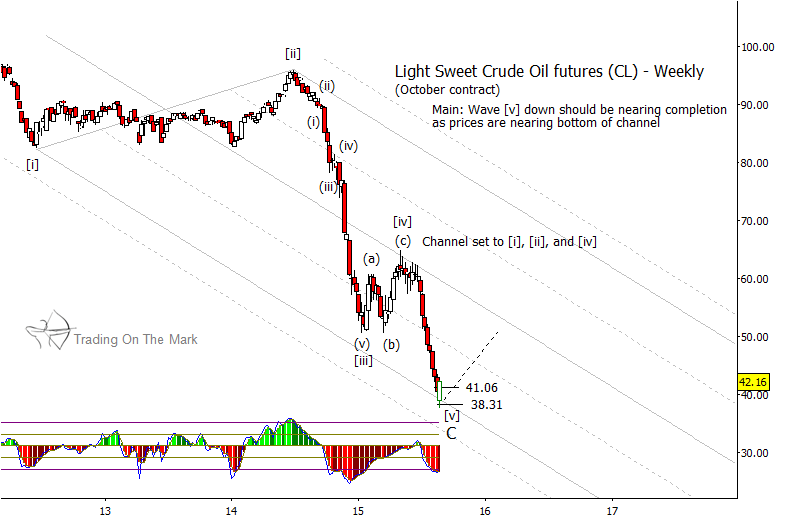
The weekly chart for the October futures contract gives a better picture of how the count worked for the large downward C wave, and it also shows how well price has obeyed channel geometry. Price reached and poked slightly below our lower target of $38.31 before bouncing strongly in what we think is probably a reversal move.
Going forward, we would like to see Crude Oil prices break through the center line of the channel shown on the weekly chart for October futures, and we would like to see a break of similar resistance on a continuous-contract chart
Crude Oil Prices (futures) Weekly Chart
Next, the weekly chart for USO shows the likely range of trading opportunities in both price and time. If the oil low is truly in, then the first big-picture price target probably will be in the low 20s, with the best estimate currently around $21.50 to $22.68. Before that, we would need to see confirmation of the upward move with price breaking through resistance at $14.52 and $15.85, as well as breaking through the upper boundary of the channel.
United States Oil Fund ETF (USO) Weekly Chart
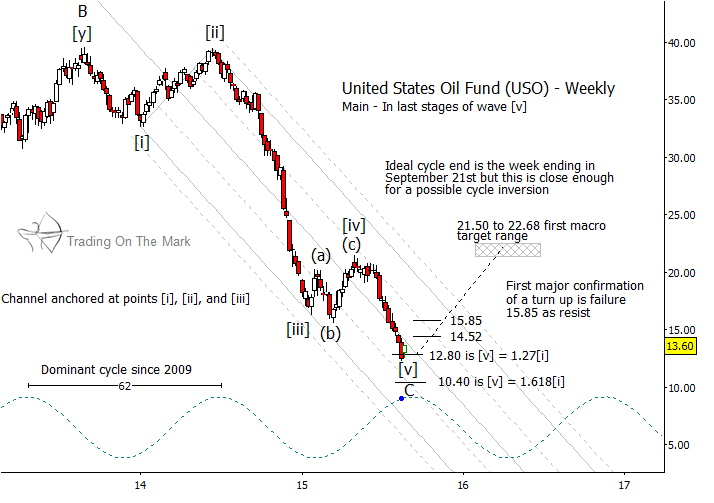
If the low is in, then the time window allows for price to move in an upward-sideways range for several more months. The dominant 62-week cycle appears to have inverted with the current low, and we expect its next (now upward) leg to persist until early 2016.
As a fallback, if price actually makes new lows in coming weeks, then we will watch $10.40 in USO as a candidate area for a reversal to begin.
Markets are becoming more volatile now. Discover how much your profits can increase with expert guidance in finding the trades. Read more here about subscribing to Trading On The Mark. Thanks for reading.
Twitter: @TradingOnMark
No position in any of the mentioned securities at the time of publication. Any opinions expressed herein are solely those of the author, and do not in any way represent the views or opinions of any other person or entity.
: Creating Bullish Divergence?")


 and Semiconductors (SMH): Concerning Price Pattern?")


