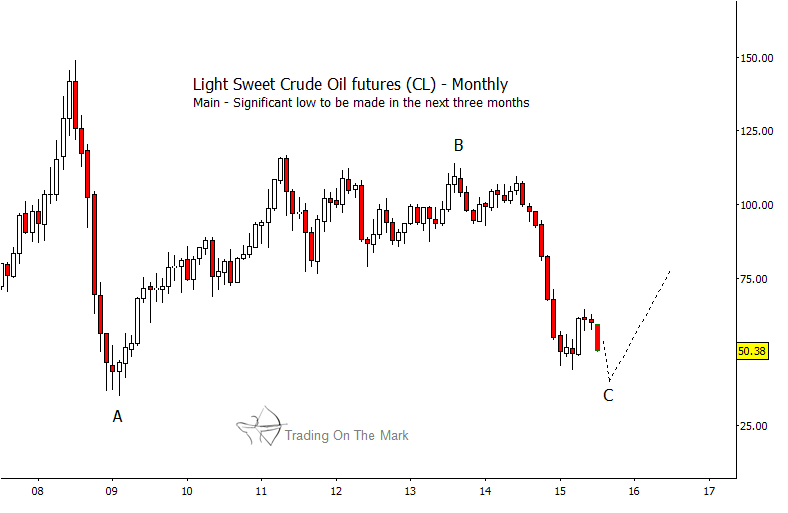
Oil prices have reached lower than most traders expected, but the move probably isn’t over yet. Crude Oil prices could slip by another 20 percent or more from current values before it puts in a durable low.
For context, we have been charting Oil futures as an A-B-C pattern down from the all-time high in 2008. The final leg of the pattern – the C wave – began as Oil prices broke down and out of a lengthy upward consolidation in 2013. Wave C should consist of five sub-waves, and it appears that the fourth of those five waves may have ended recently.
The weekly chart below offers some rough downward targets for wave [v] of C. We expect Crude Oil prices to find temporary support near its present area, perhaps allowing for a minor bounce before it breaks lower. Based on the relationships among the sub-waves of C, areas near $44.15 and $39.32 are the most probable areas to watch for a low to form.
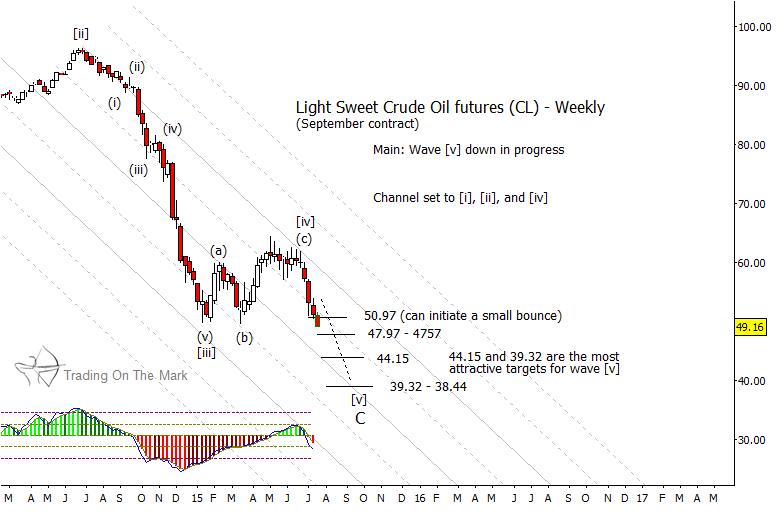
Although it cannot yet be seen on a weekly chart, wave [v] of C should itself consist of five sub-waves. If Oil prices form a minor low near its current area, that probably would represent wave i of [v], and a small bounce probably would be wave ii of [v]. Careful traders should still be able to find one or two good entries for short positions before the year is over.
At this point, anyone interested in trading this market downward should be watching a daily chart. Follow this link to receive some additional timely examples of faster charts that allow for finer targeting in crude oil and other markets. Thanks for reading.
Twitter: @TradingOnMark
No position in any of the mentioned securities at the time of publication. Any opinions expressed herein are solely those of the author, and do not in any way represent the views or opinions of any other person or entity.
: Creating Bullish Divergence?")


 and Semiconductors (SMH): Concerning Price Pattern?")


