With the buzz continuing to fly around on a oil production freeze by OPEC, it is not advantageous for either a long term or short term trader to get caught up in the news cycle. That said, if you are an active investor/trader, you also need to follow some key trend disciplines.
As crude oil prices continues to flirt and float within the $40-$50 trading range, it’s been offering intraday setups in both directions. That said, when the intraday trading action syncs up with the shorter term big picture, it becomes that much more powerful (in that direction).
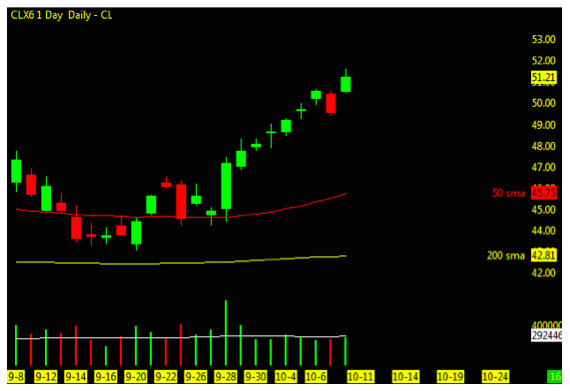
The current trend (as seen below on a regular trading hours daily chart) shows the price action holding above the 50 and 200 day moving averages. This is a positive indicator for any short term holder/trader in any situation. But we can zoom in further to understand the strength of the crude oil trading trends.
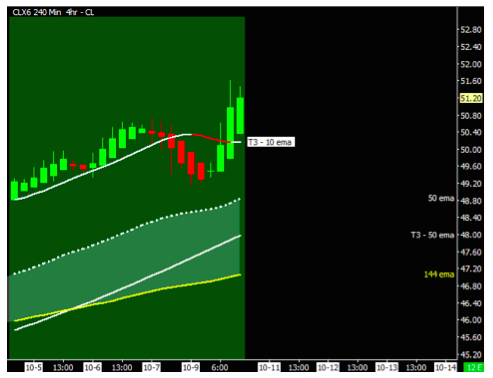
To reinforce the big picture we drop down to a four hour chart and identify that crude oil prices are holding above the 50 and 144 period moving averages. This gives strength to the crude market holding strong to the upside. Once again, a positive notch for uptrend momentum.
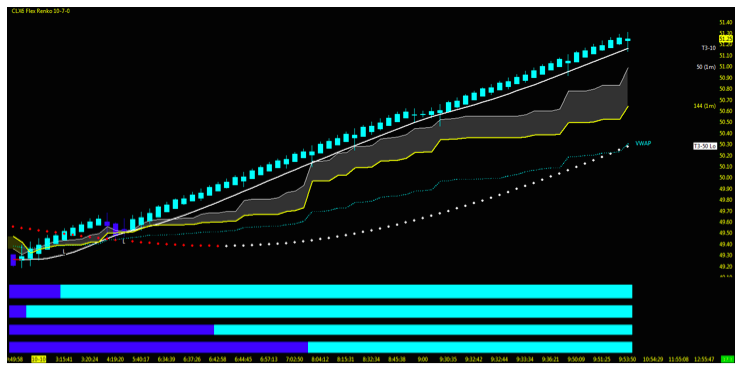
When the bigger picture is stacked in your favor, it is the intraday setup that will get you in at a good risk/reward level. And once the trade is in trend (and in sync on an intraday and day level), it is more powerful to a swing trader.
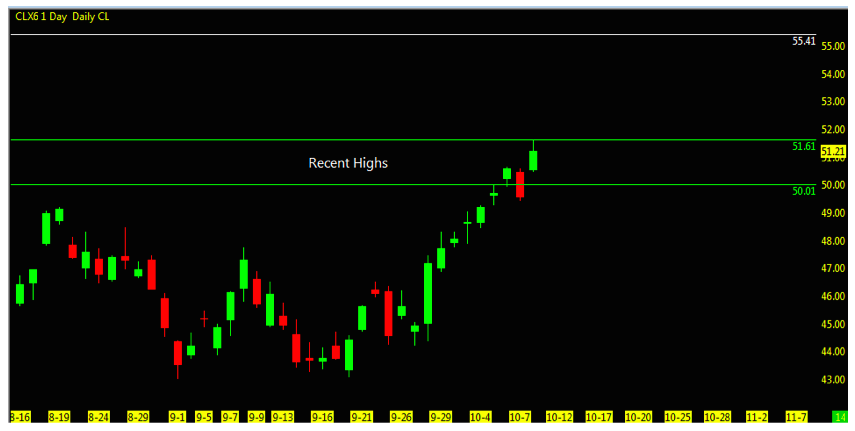
With several time frames currently supporting strength to the upside, identifying open gaps where price action has left a hole is important. This is where markets tend to migrate. The overhead gap at 55/56 is a reminder of unfinished business. It doesn’t need to be filled now, but is likely to be filled at some point. With the uptrend in play, it is the hope of any short to long term holder that the 55.41 target may be the level that we breach next after numerous attempts over the last year.
Thanks for reading and remember to always use a stop at/around key technical trend levels.
Twitter: @TradingFibz
The author trades futures intraday and may have a position in the mentioned securities at the time of publication. Any opinions expressed herein are solely those of the author, and do not in any way represent the views or opinions of any other person or entity.


