The past several months have seen the price of crude oil rise substantially. This isn’t all that surprising given that the economy is slowly recovering from last year’s COVID-19 shutdowns.
Currently, crude oil is trading near $65. That doesn’t seem all that important… until you look at today’s chart.
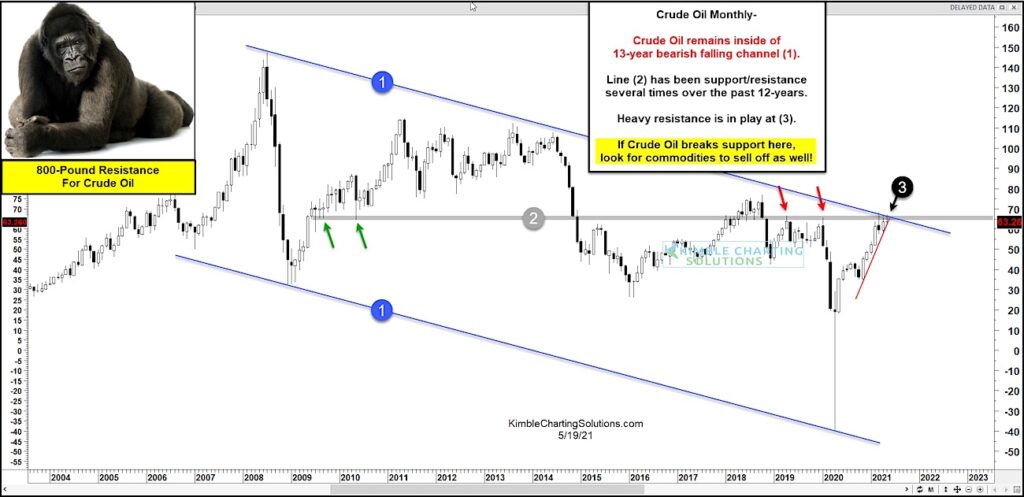
Below we have a “monthly” price chart for crude oil. And as you can see, crude oil has traded within a bearish declining channel for the past 13 years marked by each (1). We can also see a critical support/resistance line (2) that comes into play around $65.
Crude oil is currently trading where these two lines come together at (3), making this a very interesting and important resistance level to watch. It is also noteworthy that a steep up-trend (red line) formed over the past several months… so support and resistance are converging.
In my humble opinion, this appears to be an important inflection point for crude oil. Breakout or breakdown? Stay tuned!
Crude Oil long-term “monthly” Chart
Note that KimbleCharting is offering a 2 week Free trial to See It Market readers. Just send me an email to services@kimblechartingsolutions.com for details to get set up.
Twitter: @KimbleCharting
Any opinions expressed herein are solely those of the author, and do not in any way represent the views or opinions of any other person or entity.


 Rolling Over At Key Fibonacci Level?")
 Ready To Break Out?")