Steep reversals yesterday and a test of lower support levels on the S&P 500 futures charts leave stocks somewhat vulnerable to selling this morning. Crude Oil futures are rallying after a 3 day rout. Crude oil futures are back at a key price resistance (and congestion zone) – more on that further below.
The bounce action in S&P 500 futures has been met by sellers into the 1909 area – yesterday’s support zone for S&P 500 futures. The region between 1917-1923 is the main resistance area at this writing – with a likely stretch to 1928 that could still give way to selling as we see negative divergence. Longer time frame resistance levels are still sitting at 1928, 1934, 1939.5 and 1942 -1948 (that still is a messy congestion patch).
Intraday resistance sits near 1917.5. Intraday support sits at 1885. Price congestion sits between 1891 and 1894– watch this region closely – it will give us clues to moves ahead for S&P 500 futures. The big picture of stock market futures remains the same; hence, deeper pullbacks should continue to be bought-expecting to see higher lows, and expansions upward may likely be sold at higher highs– we sit in jagged ranges, while still looking for higher lows to continue.
Shorter time frame momentum indicators are sitting in neutral to negative territory. For now, this means that the sellers have a bit of the upper hand near resistance levels on stock market futures. Longer cycles are downward trending but lifting – this means upside resistance tests should be sold at first pass, but deeper pullbacks will bring value buyers back.
See today’s economic calendar with a rundown of releases.
THE RANGE OF TUESDAY’S MOTION
Crude Oil Futures (CL_F)
Oil – EIA report today – The chart for crude oil futures is trying to overtake 30.45 for the second morning after a steep sell off. Trading here is jagged as I still believe this chart to be attempting a base (potentially too early in the game, but we shall see).
Today, the trading ranges are between 29.98 and 31.04, with 30.2- 30.4 being an important congestion zone. Failure to breach this 30.55 region suggests that momentum brings us near the test of 30 again and perhaps another dip lower.
Moving averages on crude oil futures are mixed across time frames – bigger averages suggest selling bounces while faster averages suggest buying off support. This gives rise to jagged price action.
Intraday long trading setups for crude oil futures suggest a long off a 30.15 retest or 30.55 (with momentum showing positive, else that brings a lower high) into 30.85, 31.04, 31.29, 31.43, 31.62, and perhaps 31.9 if range expands
Intraday short trade setup suggests a short below a 30.10 failed retest or a failed retest of 30.9 with negative divergence showing sends us to 30.7, 30.55, 30.35, 30.16, 29.96, 29.63, and perhaps 29.20. Aggressive selling could arise at any time below 29.6, so be careful picking bottoms with crude oil futures.
E-mini S&P 500 Futures (ES_F)
Below is a S&P 500 futures chart with price support and resistance trading levels for today. Click to enlarge.
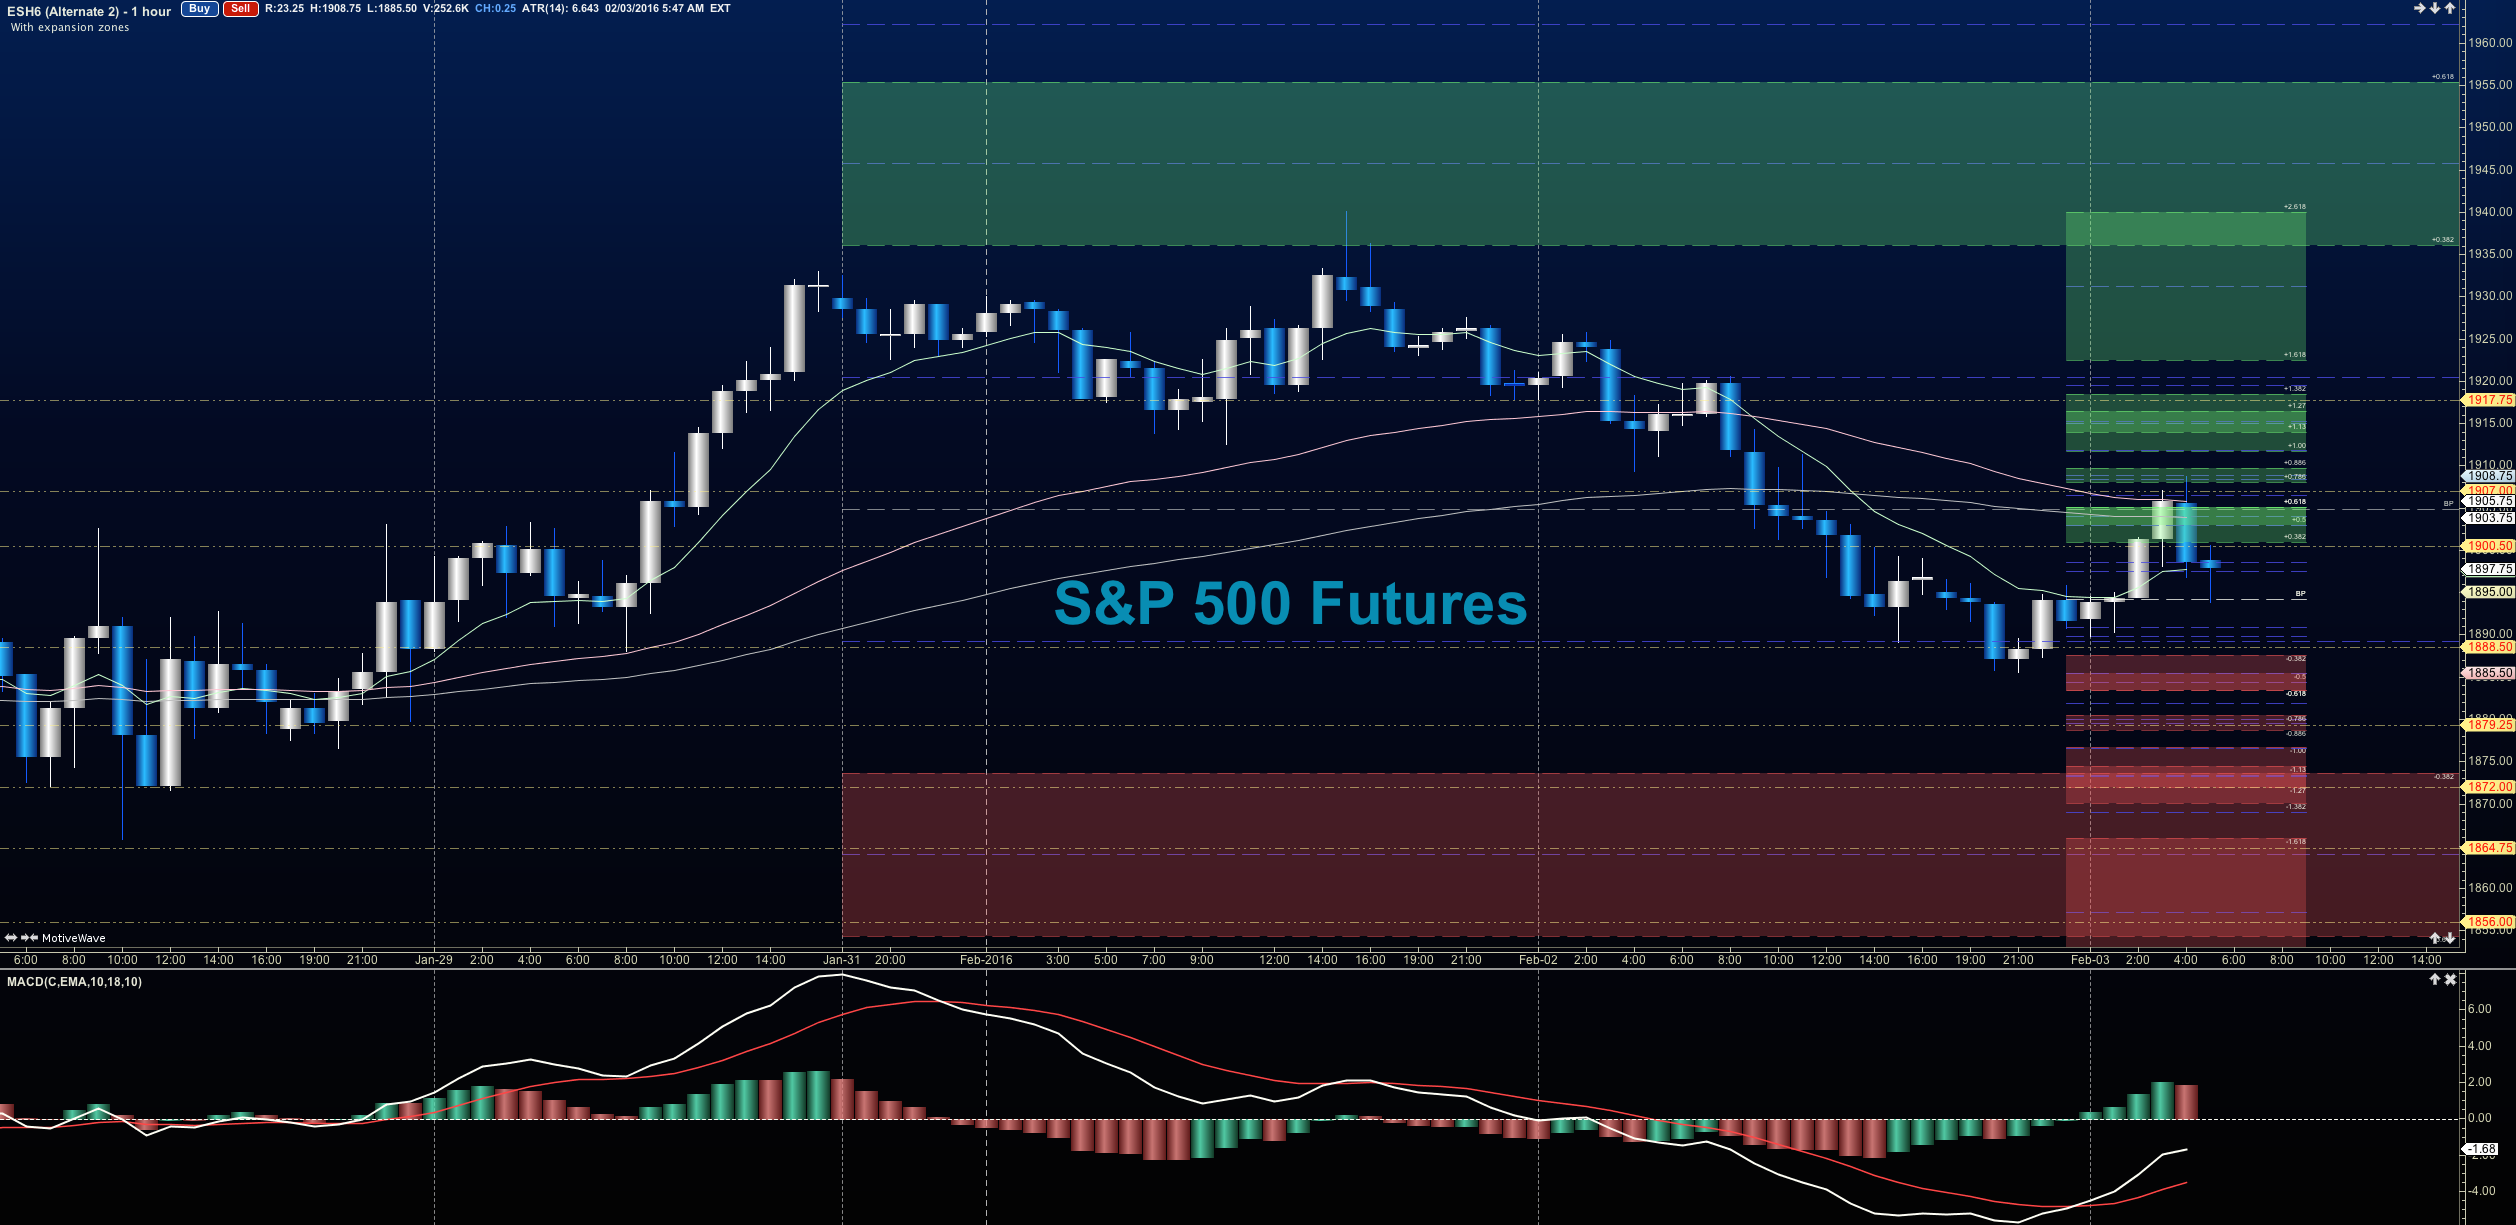
The S&P 500 futures chart holding steady near support levels. A region of important support to maintain remains near 1917-1923.
Upside motion has the best setup on the breach of and positive retest of 1910.5 – or a retest after expansion above 1917.5. Targets from 1917.5 are 1921.5, 1925, 1928.5, 1932.25, 1934.25, 1939.75, and 1942.5. Big resistance test sits at the region between 1927.75 -1929.5. The chart could expand under positive strength into 1947.75-1949 and higher if momentum lifts. Be careful- watch the higher lows to keep you on the right side of the trade.
Downside motion opens below the failed retest of 1909or at the failure to hold 1926.25 bounce. Retracement into lower levels from 1915.5 gives us the targets at 1911.5, 1907.75, 1904.75, 1902.25, 1899, 1896.5, 1892.25, and perhaps 1887.25.
If you’re interested in the live trading room, it is now primarily stock market futures content, though we do track heavily traded stocks and their likely daily trajectories as well – we begin at 9am with a morning report and likely chart movements along with trade setups for the day.
As long as traders remain aware of support and resistance levels, risk can be very adequately managed to play in either direction as bottom picking remains a behavior pattern that is developing with value buyers and speculative traders.
Twitter: @AnneMarieTrades
The author trades stock market futures every day and may have a position in mentioned securities at the time of publication. Any opinions expressed herein are solely those of the author, and do not in any way represent the views or opinions of any other person or entity.


: Important Breakout Retest")


