Deficit/Dollar
A frequently cited contributor to the Black Monday market crash was the mounting trade deficit.
From 1982 to 1987, the annual trade deficit was four times the average of the preceding five years. As a result, on October 14th treasury Secretary James Baker suggested the need for a weaker dollar.
Undoubtedly, concerns for dollar weakness led foreigners to exit dollar-denominated assets, adding momentum to rising interest rates. Not surprisingly, the S&P 500 Index (SPX) fell 3% that day, in part due to Baker’s comments.
Valuations
From the trough in August 1982 to the peak in August 1987, the S&P 500 produced a total return (dividends included) of over 300% or nearly 32% annualized. However, earnings over the same period rose a mere 8.1%. The valuation ratio, price to trailing twelve months earnings, expanded from 7.50 to 18.25. On the eve of the crash, this metric stood at a 33% premium to its average since 1924.
Technical Factors
This section examines technical warning signs in the days, weeks, and months before Black Monday. Before proceeding, note the 1st chart showing the longer-term rally from the early 1980s through the crash.
Portfolio Insurance
As mentioned, from the 1982 troughto the 1987 peak, the S&P 500 produced outsized gains for investors. Further,the pace of gains accelerated sharply in the last two years of the rally.
As the 1980s progressed, some investors were increasingly concerned that the massive gains were outpacing the fundamental drivers of stock prices. Such anxietyled to the creation and popularity of portfolio insurance. This new hedging technique, used primarily by institutional investors, involved conditional contracts that sold short the S&P 500 futures contract if the market fell by a certain amount.
This simple strategy was essentially a stop loss on a portfolio that avoided selling the actual portfolio assets. Importantly, the contracts ensured that more short sales would occur as the market sell-off continued. When the market began selling off, these insurance hedges began to kick in, swamping bidders and making a bad situation much worse. Because the strategy required incremental short sales as the market fell, selling begat selling, and a correction turned into an avalanche of panic.
Price Activity
The rally from 1982 peaked on August 25, 1987, nearly two months before Black Monday. Over the next month,the S&P 500 fell about 8% before rebounding to 2.65% below the August highs. This condition, a “lower high,”was a warning that went unnoticed. From that point forward, the market headed decidedly lower.
Following the rebound high, eight of the nine subsequent days just beforeBlack Monday saw stocks in the red. For those that say the market did not give clues, it is quite likely that the 15% decline before Black Monday was the result of the so-called smart money heeding the clues and selling, hedging, or buying portfolio insurance.
Annotated Technical Indicators
The following chart presents technical warnings signs labeled and described below.
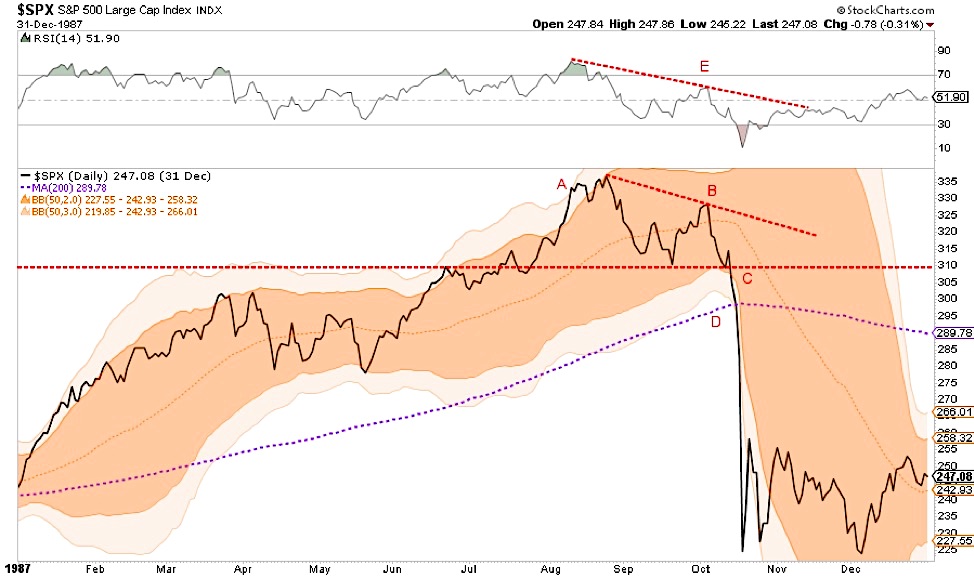
- A: 7/30/1987- Just before peaking in early August, the S&P 500 extended itself to three standard deviations from its 50-day moving average (3-standard deviation Bollinger band). Thissignaled the market was greatly overbought. (description of Bollinger Bands)
- B: 10/5/1987- After peaking and then declining to a more balanced market condition, the S&P 500 recovered but failed to reach the prior high.
- C: 10/14/1987- The S&P 500 price of 310 was a point of both support and resistance for the market over the prior two months. When the index price broke that line to the downside, it proved to be a critical technical breach.
- D: 10/16/1987- On the eve of Black Monday, the S&P 500 fell below the 200-daymoving average. Since 1985, that moving average provided dependable support to the market on five different occasions.
- E: August 1987- The relative strength indicator (RSI – above the S&P price graph) reached extremely overbought conditions in late July and early August (labeled green). When the market rebounded in early October to within 2.6% of the prior record high, the RSI was still well below its peak. This was a strong sign that the underlying strength of the market was waning. (description of RSI)
Volatility
From the beginning of the rally until the crash, the average weekly gain or loss on the S&P 500 was 1.54%. In the week leading up to Black Monday, volatility, as measured by five-dayprice changes, started spiking higher. By the Friday before Black Monday, the five-day price change was 8.63%, a level over six standard deviations from the norm and almost twice that of any other five-day period since the rally began.
A longer average true range graph is shown above the longer-term S&P 500 graph at the start of the technical section.
Similarities and differences
While comparing 1987 to today is helpful, the economic, political, and market back drops are vastly different. There are, however some similarities worth mentioning.
Similarities:
- While LBO’s are not nearly as frequent, companies are essentially replicating similar behavior by using excessive debt and leverage to buy their own shares. Corporate debt stands at all-time highs measured in both absolute terms and as a ratio of GDP. Since 2015, stock buybacks and dividends have accounted for 112% of earnings
- Federal deficits and the trade deficit are at record levels and increasing rapidly
- The trade-weighted dollar index is now at the highest level in at least 25 years. We are likely approaching the point where President Trump and Treasury Secretary Steve Mnuchin will push for a weak dollar policy
- Equity valuations are extremely high by almost every metric and historical comparison of the last 100+ years
- Sentiment and expectations are declining from near record levels
- The use of margin is at record high levels
- Trading strategies such as short volatility, passive/index investing, and algorithms can have a snowball effect, like portfolio insurance, if they are unwound hastily
There are also vast differences. The economic back drop of 1987 and today are nearly opposite.
- In 1987 baby boomers were on the verge of becoming an economic support engine, today they are retiring at an increasing pace and becoming an economic headwind
- Personal, corporate, and public Debt to GDP have grown enormously since 1987
- The amount of monetary stimulus in the system today is extreme and delivering diminishing returns, leaving one to question how much more the Fed can provide
- Productivity growth was robust in 1987, andtoday it has nearly ground to a halt
While some of the fundamental drivers of 1987 may appear similar to today, the current economic situation leaves a lot to be desired when compared to 1987. After the 1987 market crash,the market rebounded quickly, hitting new highs by the spring of 1989.
We fear that, given the economic backdrop and limited ability to enact monetary and fiscal policy, recovery from an episodic event like that experienced in October 1987 may look vastly different today.
Summary
Market tops are said to be processes. Currently,there are an abundance of fundamental warnings and some technical signals that the market is peaking.
Those looking back at 1987 may blame tax legislation, portfolio insurance, and warnings of a weaker dollar as the catalysts for the severe declines. In reality, those were just the sparks that started the fire. The tinder was a market that had become overly optimistic and had forgotten the discipline of prudent risk management.
When the current market reverses course, as always, there will be narratives. Investors are likely to blamea multitude of catalysts both real and imagined. Also, like 1987, the true fundamental catalysts are already apparent; they are just waiting for a spark.We must be prepared and willing to act when combustion becomes evident.
Twitter: @michaellebowitz
Any opinions expressed herein are solely those of the author, and do not in any way represent the views or opinions of any other person or entity.

: Showing Some Signs of Emerging Strength")
