Euro: Consumer price inflation in the Eurozone fell for the first time in five months in February. The 0.2-percent drop followed a 0.3-percent increase in January. Core CPI rose 0.7 percent, down from one-percent increase in January. Unlike the Fed, the ECB prefers to look at the headline number.
Not only is inflation failing to show up, but expectations continue to remain muted as well, evident in five-year, five-year forwards and breakeven rates.
This probably gives more ammunition to ECB doves to demand more stimulus come March 10th, when the governing council meets. But a more pertinent question is, why has not the current policy yielded results?
Even more important, what can the bank do? The ECB already have a stimulus plan in place. Rates have already been pushed into negative territory – a development that, by the way, has ended up hurting European financials.
Nonetheless, the bank will probably end up expanding its QE (currently €60-billion/month in purchases) and maybe even cut the deposit rate deeper into negative territory. Odds are Mario Draghi, ECB president, will end up underwhelming market’s lofty expectations.
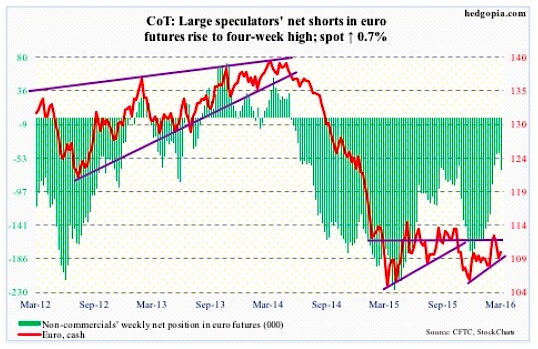
In this scenario, the euro can rally – at least near term. In fact, on both Tuesday and Wednesday, the lower Bollinger Band provided support, and the Euro has room to continue to rally on a daily chart.
The currency just lost 111 support, and a test of that resistance is possible. The now slightly declining 200-day moving average lies at 110.47, which was tested on Friday.
March 4 COT Report Data: Currently net short 68.5k, up 21.7k.
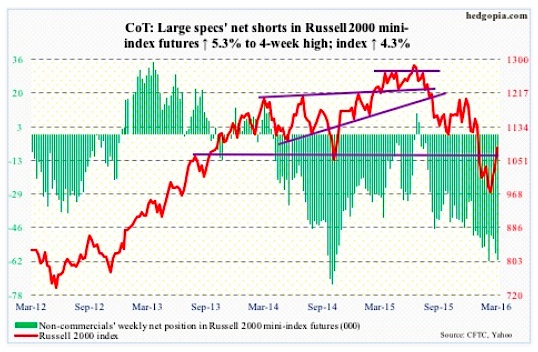
Russell 2000 mini-Index: U.S. small-caps are outperforming their other peers. Off the February 11th intra-day low, the Russell 2000 is up nearly 15 percent – better than any other major U.S. stock market index. Granted this preceded a 22-percent collapse in about 10 weeks, but price action has improved, with improving money flow.
Since February 23rd through Wednesday this week, $812 million moved into the iShares Russell 2000 ETF (IWM). That said, a lot more was redeemed during the sell-off. This year through the February 11th low, $1.2 billion left. Even since the February 11th low through Wednesday this week, $738 million was redeemed (courtesy of ETF.com). But the most recent trend is encouraging.
The only question is, what should we make of this?
For now, there is an increase in risk-on sentiment. In the four sessions ended Wednesday, $963 million moved into the SPDR high-yield bond ETF (JNK) – courtesy of ETF.com.
That said, defensives such as the SPDR Consumer Staples ETF (XLP), and the SPDR Utilities ETF (XLU) continue to hover near their all-time highs.
As well, the yield spread between two- and 10-year Treasury notes dropped to 96 basis points in the last two sessions of February – the narrowest spread since December 20, 2007. The bond market continues to forecast subdued economic activity – not something conducive to small-caps stocks that are inherently more domestically focused.
Yet, small cap stocks are rallying – hard. In this respect, what happens at 1080 resistance is worth a close watch. If a breakout occurs, would non-commercials unwind their net shorts? Thus far, they are sticking with their bearish bias, and given their record, they are worth paying attention to.
March 4 COT Report Data: Currently net short 61.2k, up 3.1k.
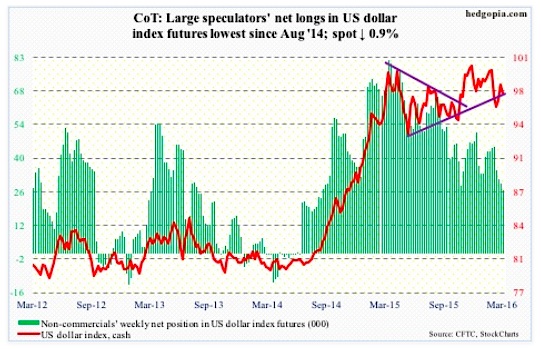
US Dollar Index: Non-commercials have got it so right. They have been cutting back net longs for a while, with holdings now the lowest since August 2014. The US Dollar index cannot get going.
Off the February 11th low through Wednesday’s intra-day high, it rallied 3.5 percent, raising dollar bulls’ hopes. Then the uptrend got cut short Thursday – the day ISM non-manufacturing disappointed – dropping 0.6 percent. The 50-day moving average has been lost. Friday, it dropped more, testing the 200-day moving average.
The path of least resistance near-term? Probably down.
March 4 COT Report Data: Currently net long 26.8k, down 2.6k.
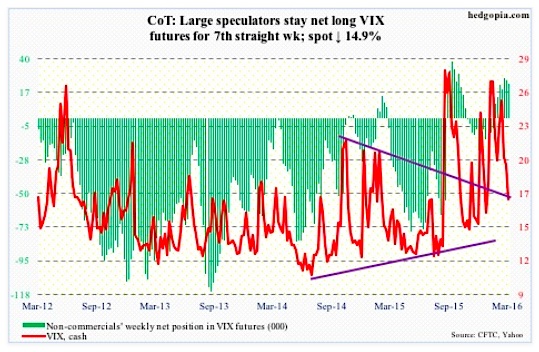
VIX: To put it simply, weekly indicators proved too powerful for the daily ones.
Last week, the Volatility Index (VIX) had a weekly bearish MACD crossover. But daily indicators were grossly oversold, with the 200-day moving average seeming to provide support. Well, that average has now been lost – the first drop below 200-DMA since December 29th.
Spot VIX Volatility Index fell another 15 percent this week. With daily momentum indicators remaining oversold for one more week, it remains compressed, with the potential to act like a spring once released. If Friday is a sign of things to come, next week will be interesting; the VIX refused to go down despite an up day for stocks.
March 4 COT Report Data: Currently net long 23.3k, down 2.6k.
Thanks for reading.
Twitter: @hedgopia
Read more from Paban on his blog.
Any opinions expressed herein are solely those of the author, and do not in any way represent the views or opinions of any other person or entity.


