The following is a recap of The COT Report (Commitment Of Traders) released by the CFTC (Commodity Futures Trading Commission) looking at futures positions of non-commercial holdings. This recap and analysis uses March 4 COT report data (as of March 1). Note that the change in COT report data is week-over-week.
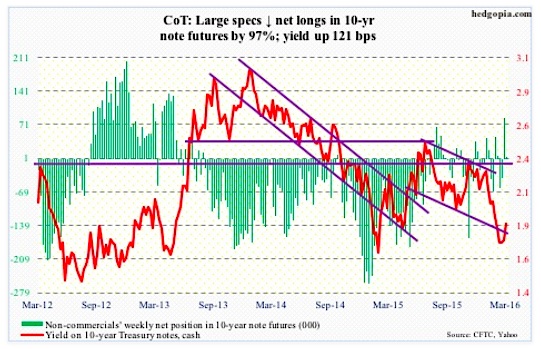
10-Year Treasury Note: Unbelievable! The Japanese government is getting paid to borrow money for a decade. For the first time ever, Japan sells 10-year bonds at negative yield. Along with Denmark, Sweden, Switzerland and the Eurozone, Japan is one of the countries to institute negative interest rate policy.
Speaking of which, the ECB meets next week, and may further cut the deposit rate (currently minus 0.3 percent).
The week after, the Federal Reserve meets. For sure, it will stand pat. Despite mid-December (2015) dot-plot forecast of four rate hikes this year, the goal post continues to shift. The focus now is on average hourly earnings, where progress is slow in coming.
On Monday, China cut its reserve requirement ratio by 0.5 percentage point (taking the level to 17 percent for the biggest banks). The idea is to enable banks to lend more, and they will oblige.
What is the message in all this? That the patient is sicker, and not getting better? That the various central bank measures adopted so far have failed to yield the desired results?
Throughout this experiment, debt – which is what led to the 2008/2009 financial crisis in the first place – has continued to rise. In the aggregate, that is.
In China, for instance, government and household debt look fine, but not corporate debt, which is elevated. Most of these corporations are state-owned enterprises, which is essentially government debt. Credit rating agencies are beginning to raise yellow flags.
If there is one lesson from the financial crisis, it is that continued credit creation cannot cure problems that emanated from excess credit. Yet we keep doing it.
Tick tock, tick tock…
March 4 COT Report Data: Currently net long 2.6k, down 82.1k.
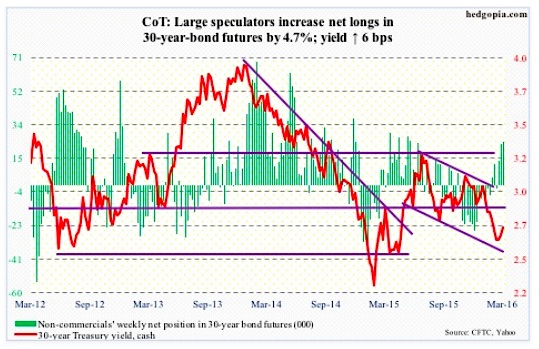
30-Year Treasury Bond: Major economic releases next week are as follows. It is a light week.
Consumer credit for January comes out on Monday. December was up 0.6 percent month-over-month to $3.55 trillion (seasonally adjusted). Over the years, this series has seen healthy growth – was $2.59 trillion when the economic recovery began in July 2009. Most prominent – and ominous – is the growth seen in student and auto loans. The former has gone from $711 billion in 2Q09 to $1.32 trillion in 4Q15, and the latter from $742 billion to $1.04 trillion.
Tuesday brings the NFIB survey. In January, its optimism index fell 1.3 points to 93.9 – the lowest since February 2014 (91.6). The index reached a cycle high in December 2014 at 100.3, which was the highest since 100.7 in October 2006. Some other notables: Comp plans fell six points month-over-month in January to 15, a five-month low, while capex plans have remained unchanged at 25 the past three months.
Stanley Fischer, Federal Reserve vice chair, speaks on Monday during market hours.
March 4 COT Report Data: Currently net long 24.1k, up 1.1k.
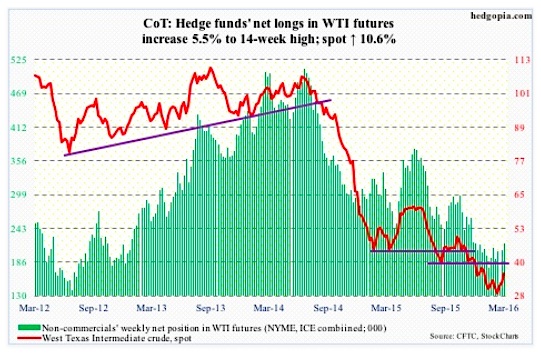
Crude Oil: Apparently, key OPEC members are meeting with non-OPEC oil producers on March 20th for talks on output freeze plan. Hopes are high. And this is what is driving price action right now.
Spot West Texas Intermediate crude oil broke out of $34-$34.50 resistance on Friday, joining the SPDR energy ETF (XLE) which broke out of resistance at $58.50 on Wednesday.
Right at this moment, market participants do not seem all that focused on other data.
U.S. crude oil supply continued to build. In the week ended February 26th, inventory rose by another 10.4 million barrels to a new record 518 million barrels. Supply has gone up by nearly 36 million barrels in the past eight weeks!
Despite this domestic supply, crude oil imports rose by 490,000 barrels per day to 8.3 million barrels per day – an 11-week high.
Distillate stocks rose as well, by 2.9 million barrels to 163.6 million barrels – a six-week high.
Gasoline stocks, however, fell… by 1.5 million barrels to 255 million barrels. Two weeks ago (258.7 million barrels), stocks were at a record.
Production fell, too – by 25,000 bpd to 9.08 mb/d. This was a sixth straight weekly drop. Production reached a record 9.61 mb/d in the June 5th (2015) week.
Also, refinery utilization rose a percentage point to 88.3. Utilization peaked at 96.1 percent in the August 7th (2015) week.
Last week saw the largest week-over-week increase in non-commercials’ net longs since October 2010. Per March 4 COT report data, they added more this week.
Besides the afore-mentioned breakout, the good thing is that the 50-day moving average is beginning to flatten out on WTI. A base is building.
A lot now depends on what comes out of the March 20th meeting. Suppose the talks fail and crude oil continues to rally? That would validate the breakout.
March 4 COT Report Data: Currently net long 218.1k, up 11.3k.
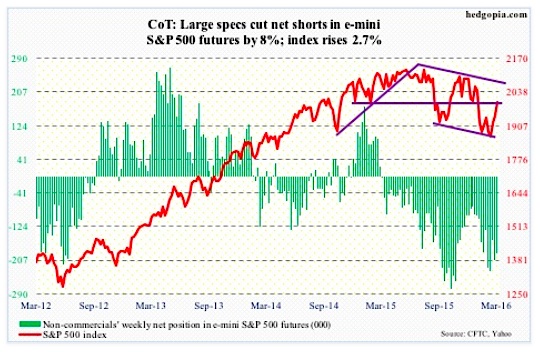
E-mini S&P 500: They did it. The stock market bulls were able to take out 1950, as well as the 50-day moving average, which is now beginning to flatten out. If they also succeed in convincingly breaking out of 1990, then that has the potential to cause more squeeze.
In the latest reporting period (January 29-February 12), short interest on the SPDR S&P 500 ETF (SPY) fell 3.5 percent period-over-period to 283.5 million, which is 35 percent less than during the September 15th period. On an index level, though, the picture is different.
Mid-February short interest on the NYSE composite was 18.5 billion – just 0.5 percent from the July 2008 all-time high of 18.6 billion. On the Nasdaq Composite, the latest tally was 9.1 billion, much lower than record 11.2 billion in July 2008, but the trend is up.
If the bulls continue to put upward pressure on prices, the high level of short interest can cause the mother of all squeezes. For this to happen, stocks need inflows. And that is the issue.
In the week ended Wednesday, another $2.4 billion came out of U.S.-based equity funds (courtesy of Lipper). The 1950 breakout took place on Tuesday, and longs used that to exit, not pile on. Stocks in general bottomed on February 11th. Since then, not a single week has seen inflows; cumulatively, outflows have totaled north of $12 billion.
This should reverse if the current uptrend in equities were to sustain itself. If flows do not improve soon, this rally will have built on a heap of sand.
March 4 COT Report Data: Currently net short 191.4k, down 16.7k.
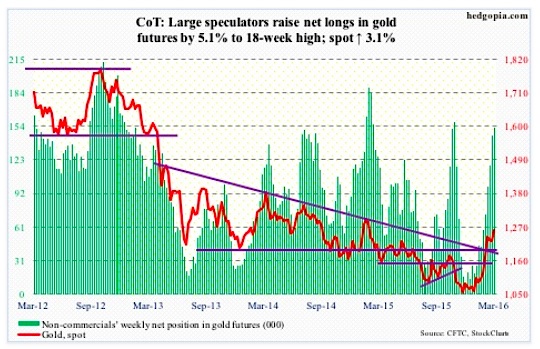
Gold: Despite the extremely overbought daily conditions and signs last week spot gold was ready to at least retest 1180 breakout, all it did was an intra-day drop to 1216 on Monday. And that was it. Buyers swooped in.
Flows are cooperating. In the four sessions ended Wednesday, the SPDR Gold ETF (GLD) pulled in another $1.1 billion. So far this year, GLD has attracted $5.4 billion.
Technically, the week also completed a daily golden crossover, so that probably created a lot of positive buzz. Plus, the spot broke out of a pennant/ascending triangle. These are continuation patterns, and are most reliable when found in an uptrend, and that is the case here.
Once again, non-commercials have been spot-on. They continued to accumulate during the two prior weeks when gold pretty much went sideways, and have been rewarded.
The spot was up 3.1 percent for the week. But here is the thing: Friday, it rallied 1.3 percent intra-day but closed the session down 0.4 percent. It was a high-volume reversal, producing a long-legged doji right outside the upper Bollinger Band. One more sign of fatigue.
March 4 COT Report Data: Currently net long 152.4k, up 7.4k.
continue reading on the next page…


