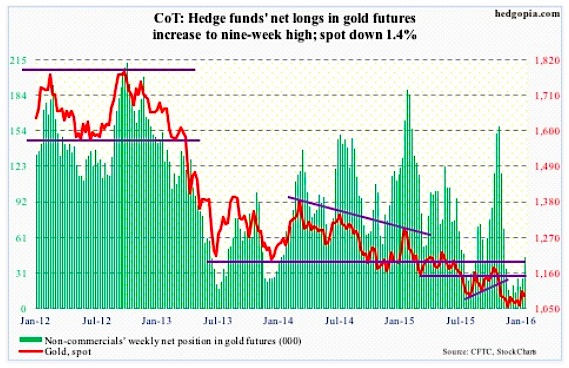
Gold: ETF.com points out that for the week ended Wednesday the SPDR Gold ETF (GLD) attracted $305 million. Gold went on to lose 1.4 percent this week anyway.
Using last Friday’s intra-day high, spot gold rallied five percent in the first five sessions, before hitting a roadblock. Although the drop this week puts Gold prices slightly past 1,080 support, which also approximates the 50-day moving average.
After having substantially cut back net longs since particularly October last year, non-commercials have been adding of late, but not with aggression shows January 12 COT report data.
January 12 COT Report Data: Currently net long 44.7k, up 18.2k.
Euro: Early last month, the ECB cut its deposit rate by 0.1 percent to minus 0.3 percent as well as extended the existing stimulus program by six months to March 2017.
Markets were disappointed. That was not accommodative enough. The Euro shot up 3.1 percent on December 3rd, and European stocks sold off.
It turns out some policymakers wanted a bigger cut in the deposit rate in that meeting. Minutes were released on Thursday. However, some others felt more accommodation would come with risks and could end up tightening financials conditions in Europe.
Mario Draghi, the ECB president, has a tough job at hand – trying to form a consensus between die-hard doves and skeptical hawks.
Non-commercials, who stayed essentially flat in the past four weeks, cut holdings this week to a nine-week low per the COT report.
January 12 COT Report Data: Currently net short 146.5k, down 14.2k.

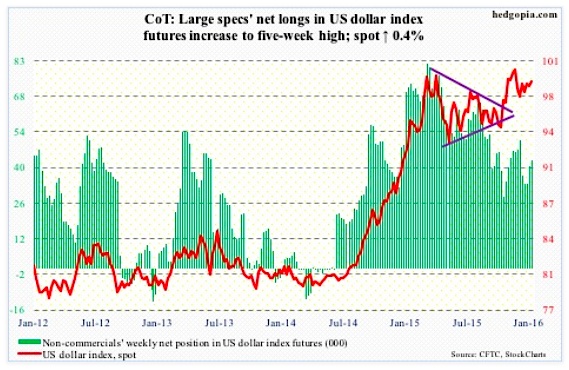
US Dollar Index: The Treasury yield curve is flattening. The two-year bill is now yielding 0.85 percent, down from 1.09 percent in late December. Lower yields, plus the Japanese yen’s perceived safe-haven status, is robbing the US Dollar Index of an opportunity to rally during this time of uncertainty and risk-off.
This is probably as good a sign as any that the US Dollar Index is in the process of peaking.
After rallying 25 percent since the middle of 2014, it backed off after reaching 100-plus, a level that was retested in November. No breakout, but the US Dollar Index continues to hover near those highs.
Non-commercials are not anticipating a breakout either. Per January 12 COT report data, holdings are substantially less versus the aforementioned highs.
January 12 COT Report Data: Currently net long 42.7k, up 2k.
VIX Volatility Index: The S&P 500 yesterday undercut August/September 2015 lows, yet the spot Volatility Index (VIX) was nowhere near its level back then.
That said, back in 2010, 2011 and of course last August, the VIX peaked in the high 40s/low 50s, before stocks could hammer out an important market bottom.
The odds of a similar spike in the VIX are looking slim. Spot volatility keeps squandering opportunities to hang on to intra-day gains. On Friday, it shot up to just under 31, but closed up only 12.8 percent to 27.02 – flat for the week.
A reversal may be around the corner.
Concurrently, for the second week, the VIX:VXV ratio closed north of one – 1.03 and 1.01, respectively.
January 12 COT Report Data: Currently net short 6.6k, down 3.2k.

Twitter: @hedgopia
Read more from Paban on his blog.
Any opinions expressed herein are solely those of the author, and do not in any way represent the views or opinions of any other person or entity.


