The following is a recap of The COT Report (Commitment Of Traders) released by the CFTC (Commodity Futures Trading Commission) looking at futures positions of non-commercial holdings within January 12 COT report data (released on January 15). Note that the change in COT report data is week-over-week.
10-Year Treasury Note: With crude oil price tanking the way it has, it is worth taking note that oil does correlate with inflation expectations. Already, the 10-year inflation breakeven rate – the spread between 10-year yields on nominal Treasury and inflation-indexed – is 1.39 percent, matching the low of late September last year.
Similarly, the five-year, five-year forward inflation expectation rate is plumbing new lows (1.66 percent as of the 14th).
Besides, yes the collapse in oil since June 2014 has to do with oversupply, but it is also reflective of the state of global growth – or a lack thereof. This then can adversely influence corporate boards’ growth expectations, and other related decisions such as capital expenditures.
This is coming at a time when at the end of 2015 S&P put 17 percent of debt-issuing companies globally on negative credit watch. This is the worst since the financial crisis.
So despite the Federal Reserve’s bravado and the FOMC dot plot’s projection of four quarter-point hikes this year, markets simply do not buy it, and are right not to do so. Just look at stocks.
The latest Beige Book particularly highlighted flat wages in the U.S.
In a speech on Wednesday, Eric Rosengren, the Boston Federal Reserve president and a voting member this year, who is otherwise one of the most dovish members of the FOMC, hinted he would not vote for another rate hike unless he sees clear improvement in the economy from here.
A day later, James Bullard, the St. Louis Federal Reserve president and a voting member, said the latest plunge in oil prices has implications for monetary policy.
Two back-to-back dovish comments!
Will the stock market listen? Or care?
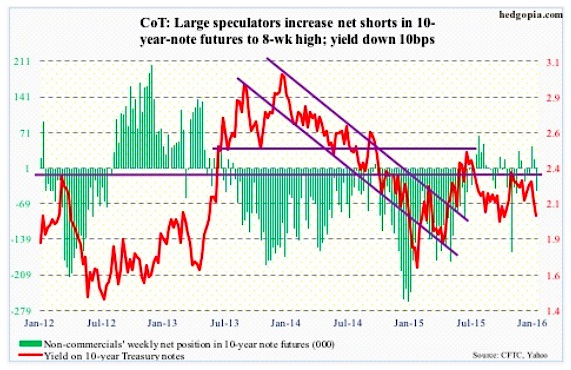
The long end of the yield curve has spoken wide and clear, with the 10-year yield having dropped intra-day from 2.38 percent to 1.99 percent in the past couple of months.
January 12 COT Report Data: Currently net short 43.2k, down 61.5k.
30-Year Treasury bond: Major economic releases next week are as follows.
Monday is Martin Luther King Jr. Day.
The NAHB/Wells Fargo housing market index for January comes out on Tuesday. December was down a point to 62. The index reached a 10-year high of 65 in October last year.
Also on Tuesday, we get the TIC data for November. It has been a while foreigners have been exiting U.S. stocks. The last time the 12-month moving average of net foreign purchases was positive was October 2013. Separately, China, the largest holder of Treasury securities, has been cutting back, but ever so slightly. It held $1.25 trillion in October, versus $1.27 trillion in June last year; holdings peaked at $1.32 trillion in November 2013.
Wednesday has December’s consumer price index on tap. Prices were flat in November. In the 12 months through November, the CPI increased 0.5 percent. Core CPI increased 0.2 percent – the third straight month of 0.2-percent gain. And in the 12 months through November, core CPI rose by two percent (2.02 percent, to be exact) – the largest increase since May 2014. The Fed targets two percent inflation, but core PCE, its favorite inflation gauge, is running much softer.
Housing starts for December are scheduled for Wednesday as well. November was up 10.5 percent month-over-month to a seasonally adjusted annual rate of 1.17 million units, following a 12-percent decline in October. Starts reached a high of 1.21 million in June, with momentum of late. The 12-month moving average has been north of one million for 12 straight months.
December’s existing home sales are due out on Friday. In November, sales dropped 10.5 percent to a seasonally adjusted annual rate of 4.76 million units – the first sub-five million reading in nine months. The median price was $220,300, not that far away from the all-time high of $236,300 in June last year.
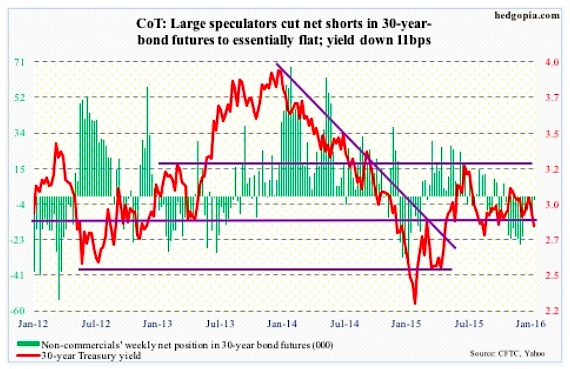
January 12 COT Report Data: Currently net short 1.8k, down 6.4k.
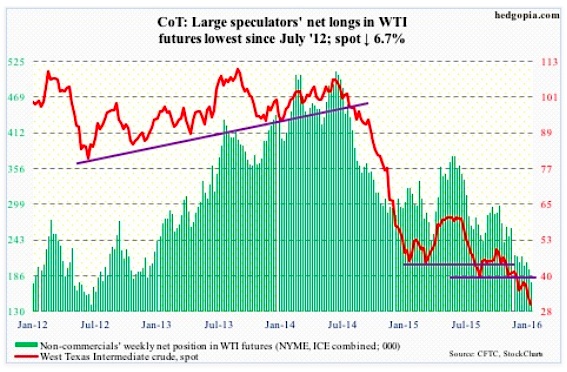
Crude Oil: Oil prices dipped below $30/barrel on Tuesday for the first time in 12 years. Hat tip to brokers with calls that once looked insanely bearish – most notably Citibank (C), Goldman Sachs (GS), and Morgan Stanley (MS) that each have a $20 call on spot West Texas Intermediate crude oil.
The EIA report for the week of January 8th was no help to the crude oil.
Stocks of crude oil increased by 234,000 barrels, to 482.6 million barrels. Four weeks ago, stocks were 490.7 million barrels, which was a hair’s breadth away from the all-time high 490.9 million barrels in the April 24th week.
Oil production rose by 8,000 barrels per day, to 9.23 mbpd – a 20-week high. Production peaked at 9.61 mbpd in the June 5th week.
Refinery utilization fell by 1.3 percent, to 91.2 percent – an eight-week low. Utilization peaked at 96.1 percent in the August 7th week.
Gasoline stocks surged 8.4 million barrels, to 240.4 million barrels – the highest since the February 13, 2015 week. This was the ninth straight weekly increase.
Distillate stocks rose by 6.2 million barrels, to 165.6 million barrels – the highest since the January 21, 2011 week.
With the 6.7-percent drop this week on spot WTI crude oil, the first line of resistance lies at $32, then $34.50 and then $38, then… resistance is galore.
Non-commercials continue to reduce net longs, according to January 12 COT report data. Holdings are now at the lowest since July 2012.
January 12 COT Report Data: Currently net long 175.9k, down 20.3k.
E-mini S&P 500: Through Wednesday, $21 billion left U.S.-based equity funds this year – $9 billion in the latest week (courtesy of Lipper). No wonder stocks have taken a shellacking.
That said, at the risk of sounding desperate, here is a silver lining in the cloud. Major stock market indices are near/slightly past September lows. Since September 30th (the S&P 500 bottomed on the 29th), nearly $30 billion has been withdrawn. Despite these huge outflows, stocks have only gone sideways.
At least in the near-term, the path of least resistance is probably up. However, unlike in late September from where major U.S. stock market indices all rallied double digits, this time around stocks may not be as lucky. The difference between then and now is short interest.
On the Nasdaq, end-December short interest stood at 8.7 billion shares, versus 9.5 billion three months ago. On the NYSE, this was 17.4 billion and 18.4 billion, in that order. This is true across sector/industry ETFs, with energy being the major exception. Potential short-squeeze fuel is lacking.
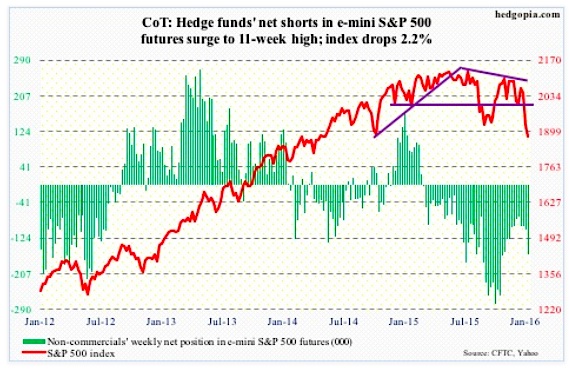
After a six-percent collapse in the prior week, the S&P 500 lost another 2.2 percent this week.
Non-commercials played it perfectly: January 12 COT report data showed they raised net shorts to an 11-week high. That said, holdings are substantially less than during September/October last year.
January 12 COT Report Data: Currently net short 162.3k, up 58.1k.
continue reading on the next page…


