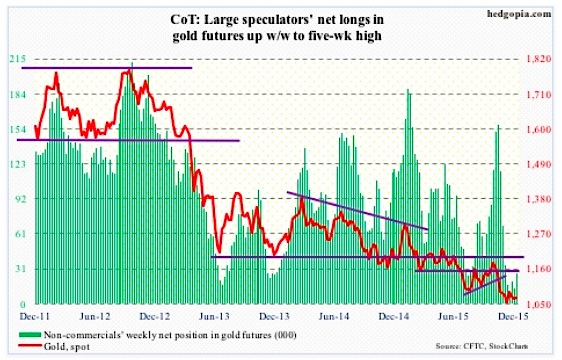
Gold continued
In the meantime, shorter-term moving averages have stopped going down. A nice push higher here can improve the yellow metal’s picture – at least near-term. But it continues to struggle.
Yesterday, Gold prices closed near the aforementioned averages. The metal simply followed oil lower.
Non-commercials are yet to show massive enthusiasm for gold. Nevertheless, they have been adding since the multi-year low early this month, per COT Report data December 28. Three weeks ago, they had the least net longs since October 2002.
COT Report Data December 28: Currently net long 26.4k, up 12.8k.
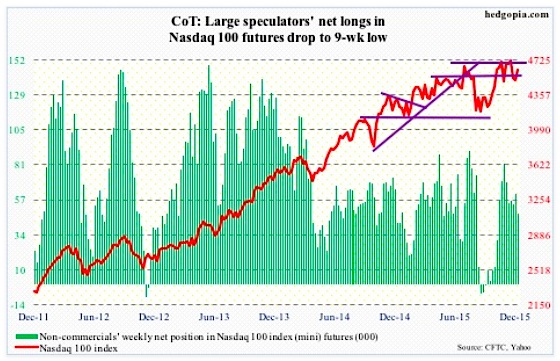
Nasdaq 100 Index (mini): The 4560 level continues to act like a magnet. Having lost it in the prior week, the index recaptured the level last week.
There is room for the index to push higher near-term, but here is the thing:
Daily momentum indicators such as the RSI and stochastics have reached the median, and this is where tech stocks can turn back if momentum is weak.
Apple (AAPL), which constitutes nearly 13 percent of the index, continues to be a wild card. It remains oversold on a daily chart, but has broken its June 2013 trend line. Moreover, there is potentially a head-and-shoulders pattern forming on a weekly chart, with the neckline break occurring around $105, which was saved last week.
Non-commercials continue to cut back net longs – now at a nine-week low.
COT Report Data December 28: Currently net long 47.9k, down 13.6k.
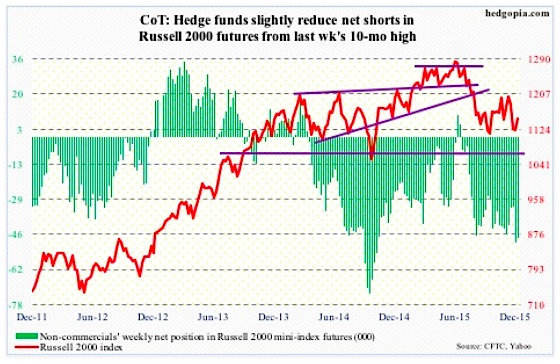
Russell 2000 mini-Index: Short interest on the iShares Russell 2000 ETF (IWM), dropped 4.4 percent, to 99.7 million shares – an eight-month low. Since the end of September, it has dropped 24 percent. Between the periods, the Russell 2000 was up a mere 2.8 percent. Not much to write home about.
For a while now, investors/traders have not been showing much love for small-caps stocks.
The 1210-1215 resistance has been in place since March 2014. Most recently, a rally attempt was repelled early this month. Before this gets tested again, small-cap bulls will have to now take out another resistance – 1170, which approximates the 50-day moving average.
The 200-day moving average is now pointing lower, with the 50-day flattish.
Non-commercials, having had bearish bias on small-caps for a while, in the prior week raised net shorts to a 10-month high.
COT Report Data December 28: Currently net short 47.2k, down 2k.
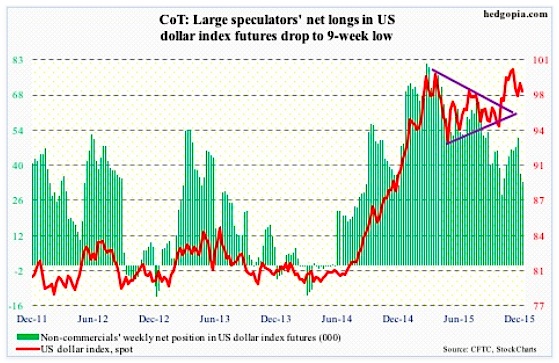
US Dollar Index: The dot plot tells us that FOMC members would wish to hike four times next year. Futures traders are pricing in only two. The US Dollar Index is so far not buying the Fed’s hawkish message.
Back in March, the US Dollar Index reached a high of 100.71, before backing off. Then in November, that high was retested, as it rose to 100.60, before coming under renewed pressure.
Since the FOMC decision in the middle of the month, the US Dollar Index is essentially unchanged, let alone take another stab at the afore-mentioned highs.
Also, non-commercials are nowhere near as net long US Dollar Index futures as they were back in March. In fact, in a week in which the Fed was all but certain to raise rates, non-commercials reduced net longs by 28 percent.
Last week, they cut back more, with holdings at a nine-week low.
COT Report Data December 28: Currently net long 33.4k, down 3.5k.
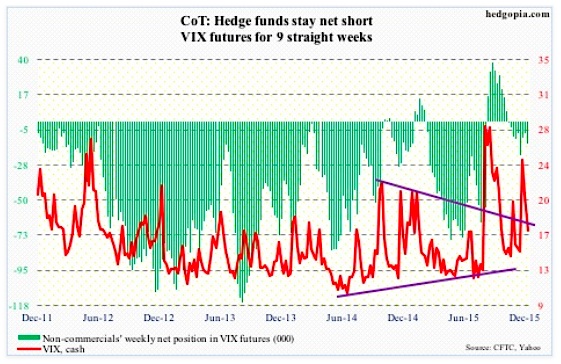
VIX Volatility Index: It has been a while spot VIX has vacillated around its 50- and 200-day moving averages. Having briefly dipped below 15 last Friday, the VIX once again surged past both on Monday… although it was unable to close out the session near the highs.
Daily momentum indicators are oversold, and look to be itching to move higher.
In the meantime, the VIX-to-VXV ratio dropped to 0.8 last Friday – onto oversold zone – before rising to 0.86 yesterday. There is room for it to continue moving higher before it gets to overbought zone, and that could spell trouble for stocks.
Spot VIX’s probable path of least resistance near-term is up.
COT Report Data December 28: Currently net short 13.8k, up 6.4k.
Thanks for reading.
Twitter: @hedgopia
Read more from Paban on his blog.
The author does not have a position in any of the mentioned securities at the time of publication. Any opinions expressed herein are solely those of the author, and do not in any way represent the views or opinions of any other person or entity.


: Showing Some Signs of Emerging Strength")
