The following is a recap of The COT Report (Commitment Of Traders) released by the CFTC (Commodity Futures Trading Commission) looking at futures positions of non-commercial holdings as of December 22 (with release of COT report data December 28). Note that the change in COT report data is week-over-week.
10-Year Treasury Note: The Chicago Fed’s National Financial Conditions Index (NFCI) has been tightening – from -0.92 in June last year to the latest -0.57. This is the tightest since November 2012. When the index rises, it indicates deteriorating financial conditions.
The Federal Reserve just raised the funds rate by 25 basis points, to 0.37 percent, after pinning it on the floor for seven long years. So what exactly is the NFCI trying to tell us? That the Federal Reserve’s zero interest-rate policy is no longer providing a tailwind?
That said, we are yet to hear of financial firms being in trouble. Or, for that matter, people not making margin calls.
Nevertheless, the steady rise in NFCI is coming in the midst of a Fed that is looking toward four more quarter-point hikes next year. Markets expect two. Odds favor the latter wins.
Here is a scenario in which the Federal Reserve may indeed end up going for four.
The budget deal passed this month by Congress allows for extension of tax breaks, increase in military spending, and expansion of government programs. The Wall Street Journal expects the bill to add $800 billion in new deficits in the current fiscal year. And Strategas Partners believes this could add as much as 0.7 percent to GDP in 2016.
The long end of the yield curve does not buy into this scenario. We’ll wait and see if stocks do.
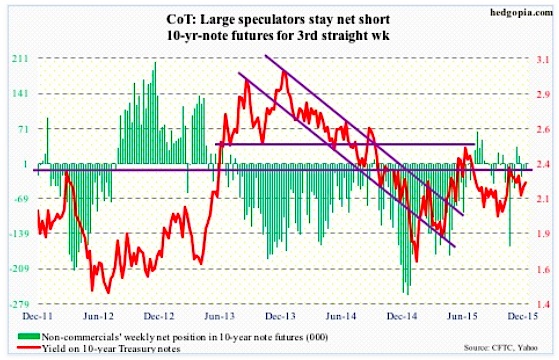
That said, non-commercials have stayed net short the past three weeks per the latest COT report data December 28.
COT Report Data December 28: Currently net short 12.2k, up 767.
30-Year Treasury Bond: Happy New Year! It is a holiday-shortened week, and major economic releases are as follows.
Later this morning, the S&P/Case-Shiller home price index is reported for October. Home prices are still rising but the pace is decelerating. In September, price rose 4.9 percent nationally – faster than 4.3 percent in February this year but substantially weaker than the 10.9-percent pace in October 2013.
November’s pending home sales index is published on Wednesday. In October, it rose two-tenths of a point to 107.7, but remains nearly five points below the May 2015 high of 112.3. As the index has weakened, existing home sales have followed. Sales collapsed 10.5 percent in November, to a seasonally adjusted annual rate of 4.76 million unis. Earlier, they peaked in July this year at 5.58 million – the highest since 5.79 million in February 2007.
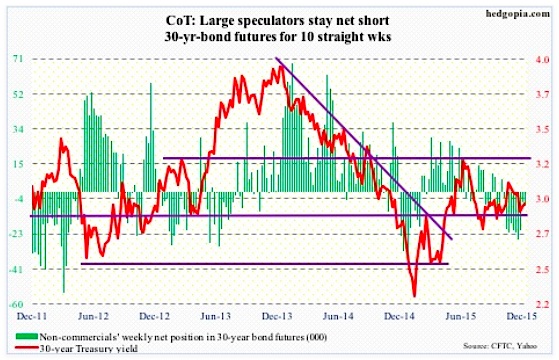
COT Report Data December 28: Currently net short 7.5k, up 1.7k.
Crude Oil: On Tuesday through Thursday last week, for the first time since 2010, spot West Texas Intermediate crude oil settled above spot Brent. The streak continued yesterday. The former is getting bid up because of prospects of tighter supply post-lifting of a 40-year exports ban. The irony in all this is that now it is cheaper to import crude… hence anyone’s guess as to how long the spread continues to favor the WTI.
Speaking of which, in the week ended December 18th, crude oil imports fell by 986,000 barrels, to 7.33 million barrels – a five-week low. The prior week was the highest since 8.36 mbpd in the September 27, 2013 week.
The EIA report also showed crude oil stocks fell by 5.9 million barrels, to 484.8 million barrels, more than offsetting the prior week’s increase. Last week’s 490.7 million barrels was just a hair’s breadth away from the all-time high of 490.9 million barrels in the April 24th week.
Distillate stocks also fell by 661,000 barrels, to 151.3 million barrels, from last week’s 13-week high.
Oil production rose by three million barrels a day, to 9.18 mbpd – a three-week high. Oil production peaked at 9.61 mbpd in the June 5th week.
Refinery utilization fell for a third consecutive week, to 91.3 percent. Utilization peaked at 96.1 percent in the August 7th week.
Gasoline stocks rose by 1.1 million barrels, to 220.5 million barrels – a 10-week high. This was the sixth straight weekly increase.
Oil bulls were able to build last week on the prior week’s doji, as spot WTI crude oil prices rose 6.4 percent.
Resistance is galore, with the nearest lying at 40, and after that 43, which also approximates the 100-day moving average. The 50-day moving average lies at 41.55.
With the 3.8-percent drop yesterday, spot WTI crude oil is literally sitting on its slightly rising 10-day moving average.
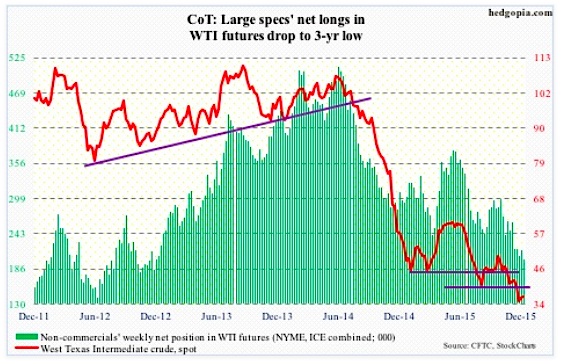
Non-commercials have been reducing net longs for a while now, per COT report data December 28. And they continue to do so, with holdings now at a three-year low.
COT Report Data December 28: Currently net long 202.1k, down 14.2k.
E-mini S&P 500: Outflows from stocks continued in the week ended last Wednesday. Another $7.6 billion exited U.S.-based equity funds (courtesy of Lipper). In the past three weeks, north of $29 billion came out of these funds. And since September 30th, $18.6 billion left.
This may be why shorts are beginning to press a little. Short interest on the SPDR S&P 500 ETF (SPY) went up eight percent mid-December, to 312.7 million shares. This is the highest in two months. That said, it is some 28 percent below the high three months ago.
Back then, shorts persistently built into that mid-September high, just when stocks were about to bottom out and rally. Soon followed a squeeze, with S&P 500 (SPY) short interest dropping to 278 million by the middle of November.
Viewed this way, the present level of short interest is probably not enough to set in motion another squeeze cycle for stocks. Besides, as stated earlier, flows are not cooperating.
Seasonality still favors stocks, though… at least that has been the case historically. But it is also a known seasonal phenomenon, with traders increasingly positioning earlier.
In the very near-term, there is room to rally. Daily overbought conditions still have room left for unwinding. Daily MACD just crossed up.
Here is the rub. With last week’s rally the S&P 500 sat right on its 50- and 200-day moving averages. Come Monday, it lost both. The consolation is that the S&P 500 Index finished substantially off the lows yesterday.
The level to watch is 2090 on the way up and 2040 on the way down, followed by 2020 and must-hold 1990.
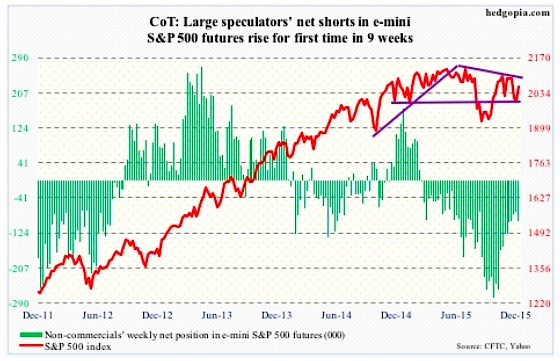
For the first time in nine weeks, non-commercials added to net shorts.
COT Report Data December 28: Currently net short 95.2k, up 19.9k.
Euro: The Spanish general elections in the prior weekend splintered Madrid’s parliament. Yields shot up. So far, there is no contagion. The sell-off in Spanish bonds is contained.
The traditional two-party dominance was broken in that nation. Podemos, an anti-austerity party, is banging on doors of power, securing nearly 21 percent of seats. Is this a prelude to what is to come in Italy, France, etc.? And how will these movements weigh on the Euro?
If it gathers momentum in months and years to come, I believe it can have huge implications for the Euro. Markets had a brief glimpse into this after Greece’s Syriza party came into power early this year, only to see it capitulate later.
For now, the Euro is hanging on to the gains post-ECB disappointment on December 3rd. The rising 20-day moving average is providing support, with the currency currently trapped between 50- and 200-day moving averages.
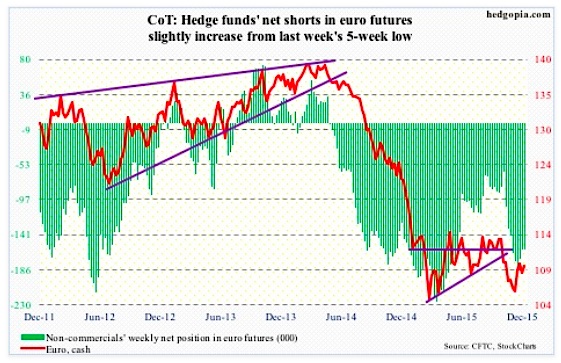
Non-commercials slightly added, and continue to remain heavily net short.
COT Report Data December 28: Currently net short 161k, up 1.1k.
Gold: It has been more than a month since Gold lost 1,080. Since then, Gold prices have dipped as low as 1,045. But that low has yet to be undercut.
…continue reading on the next page.


