First-quarter earnings season is wrapping up with about 90% of constituents in America having reported. Canada is a little farther behind at 70%.
As you would imagine, outside of firms providing video conferencing, e-commerce, disinfectant manufacturing or companies making expensive at-home exercise bikes, good news was hard to come by this season.
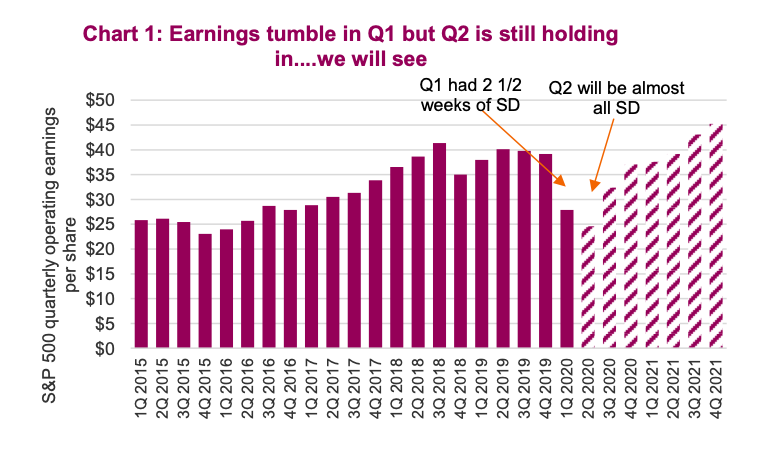
The market as a whole has seen operating earnings for S&P 500 Index INDEXSP: .INX constituents fall 27% compared to Q1 2019, from $37.99 down to $27.89.
There is no question the pandemic started to impact corporate earnings before social distancing was broadly adopted.
Notably, the Q1 drop in earnings captures a mere 21⁄2 weeks of true social distancing (denoted as SD in Chart 1), which is now in its ninth week.
The point is, Q2 earnings are going to be almost completely impacted by social-distancing efforts, even if we start to relax restrictions within a few pockets of the economy.
Guidance, dividends, share buybacks all being cut
As companies look into the abyss of uncertainty, they are removing forward guidance. This is perfectly acceptable; without a clear plan for the removal of social distancing, management of many businesses simply have no foresight into future business conditions. That makes it difficult for analysts too, who will often use guidance as an input into their own projections.
Since the start of the pandemic and social distancing, we knew two things for sure: (1) Economic data would soften; and (2) Expectations for the future would change and be nearly impossible to predict. That is why guidance has been withdrawn, share buyback programs paused and dividends slashed to preserve balance-sheet strength to weather the storm.
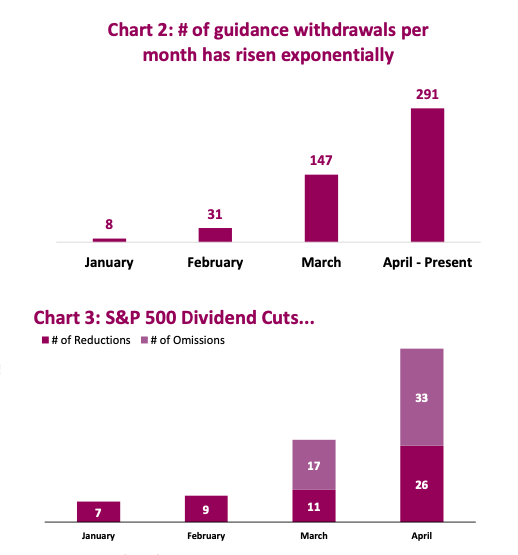
It is an inherently difficult task to forecast the future at the best of times, let alone in a beleaguered environment such as today’s. Yet, the pace of these guidance withdrawals has been rather jarring. We analyzed every press release issued by S&P 500 and TSX-listed companies using natural language processing since February, and found that so far, a total of 477 North American companies have pulled their forward forecasts (Chart 2).
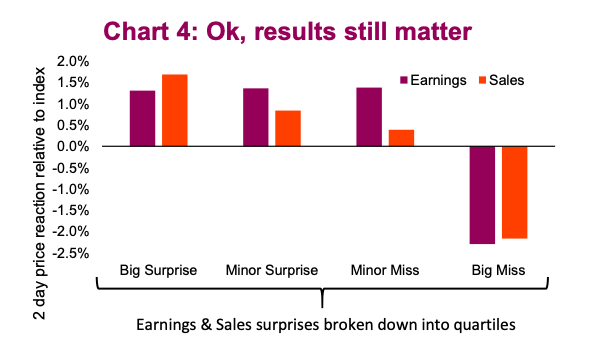
As for dividends, the story is much the same, with the number of cuts rising in each successive month. To date, 17 TSX-listed companies have reduced their dividends and 12 have outright omitted them. South of the border, the story is the same, with 26 reductions and 33 omissions across the S&P 500 (Chart 3). Given the unknowns that lay before us, one can only assume that companies will continue to guide lower, cut dividends, and in some cases file for bankruptcy protection.
Earnings – Falling, falling, falling
Some good news is markets are not over-reacting to negative earnings news. Much like how the market seems fine with historically weak economic data, poor company results seem to be getting a pass as well. However, if they get hit especially hard, look out!
The two sectors hit the hardest during Q1 are, not surprisingly, Consumer Discretionary and Financials. With social distancing, fewer folks are shopping. Meanwhile, Financials bear the brunt of the overall economy from consumer spending and defaults ranging from corporations to real estate owners.
Companies have seen their operations disrupted to various degrees, and while there are some winners, the number of losers vastly outnumbers them. Q1 has probably given investors a sampling of what could transpire in Q2 earnings season during the month of July. Q2 average estimates for the S&P 500 aggregate earnings have dropped from $43 in mid-February to $24.30. That compares to earnings of $27.89 in Q1.
We forecast that Q2 consensus estimates will continue to fall over the coming weeks. Social-distancing measures are likely going to fade slowly, and consumer demand probably won’t snap back. This is also the first-time analysts don’t have the management teams guiding them in the right direction. Also, sell-side analysts tend to rachet estimates lower and higher, opposed to making a big move up or down to their actual target in one swooping change.
The market is still paying attention to individual earnings results. We believe this is more of a macro-driven market at the moment, with health data and government policy responses driving prices broadly.
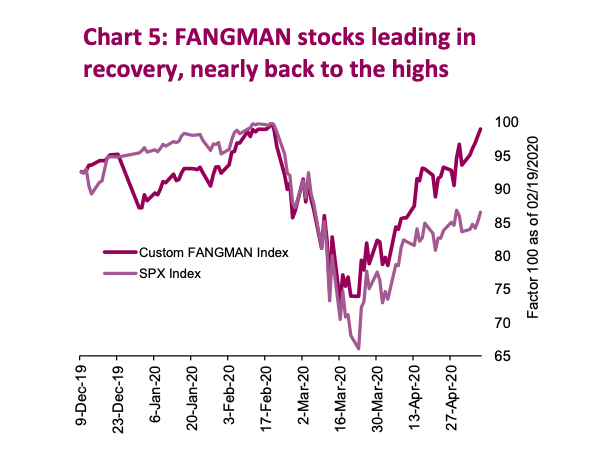
However, the micro individual company results appear to be driving share prices too. Chart 4 is the 2-day price reaction for S&P 500 companies after they reported earnings; it is broken down into quartiles based on how much they surprised or missed. This performance is relative to the market. Clearly, missing or beating Q1 estimates had an impact on a company’s share price; briefly letting company fundamental results drive the share price, before the macro takes over again.
Let’s concentrate on concentration
One of the more recent acronyms created by our investor brethren is FANGMAN, which is short for Facebook, Alphabet, Netflix, Google, Microsoft, Apple and NVIDIA. Together they comprise nearly a quarter of the S&P 500 – the highest level of concentration in more than 30 years.
The issue with index concentration is that it creates a lack of market breadth. To put that in context, over half the S&P 500 index constituents are still trading 20% or more below their levels on February 19, when as an equal weight FANGMAN index is back at all-time highs (Chart 5).
Eventually, narrow market breadth resolves itself in one of two ways: (1) The select group of market leaders fail to live up to heightened expectations because we’re entering into a recession with prolonged consumer and businesses spending constraints. This would be the “catch down” effect as the leaders drift down, closing the gap to the rest of the broader market; (2) The alternate resolution is the “catch up” situation where the broad market beats expectations, in effect catching up to the current leaders.
For now, the overall market is benefiting from being top heavy. The market leaders are doing extraordinarily well. Chart 6 shows the contribution of the FANGMAN members since the great bounce off the March 23 lows. The market is up an impressive 29%; without these seven stocks it would have only been 22% higher (left column in Chart 6). This is a significant contribution from a select few for an index with over 500 members.
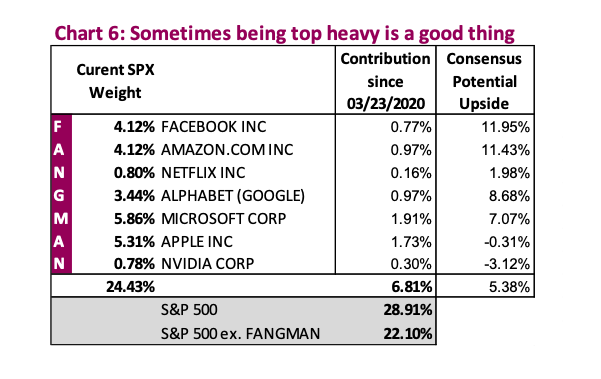
The concern many investors have is how much more upside can there be from here for these tech darlings. Looking at consensus (right column in Chart 6), analysts estimate there is on average just 5% upside potential for these market leaders over the next 12 months. The earnings outlook for this group is fairly favorable, all things considered, and perhaps are overly optimistic. Expectations are for a shallow dip in Q2 followed by strong growth in 2021 and beyond. It’s hard to imagine in a year from now using more Netflix or Instagram when there are actually other things to do. Analysts are perennial optimists, and tend to anchor their opinion on outperforming stocks – this isn’t new, we even catch ourselves and team members doing it on occasion. The risk to the overall market appears to be a concentrated risk in a small group of companies hoping to meet already heightened expectations.
Investment implications – Catch up or catch down?
Trying to predict the path of the virus would amount to a guess: the length of time to bring it under control; whether we will see a second wave of infections; and the speed at which the economy will recover thereafter.
Thus, we continue to believe that balance sheet strength, liquidity and thinking longer-term have never been more important. For most companies, growth appears to be out of the picture this year and the markets are likely to observe more negative data in 2020. Survivability and operational sustainability are the name of the game.
The tech giants that are benefiting from economies of scale, changing consumer behaviours and access to historically cheap capital propelling them higher and dragging the market along with them. There is certainly a dichotomy between FANGMAN and the private small- and medium-sized businesses (SMEs) that are not reporting this earnings season, or ever. If there was a private company index of barbershops, mom and pop restaurants and one-off gyms, it would be much more than 20% off the peak. The question is whether the overall market catches up to the tech leaders or catches down to the SMEs and economic data.
In our opinion, the latter is more likely and the reason we have been lowering equity exposure and beta. But it is important to remember it should never be “all in” or “all out” – it is about tilting your asset allocation more aggressively or defensively based on your future expectations and individual portfolio baseline asset allocation.
Source: All charts are sourced to Bloomberg L.P. and Richardson GMP unless otherwise stated.
Twitter: @ConnectedWealth
Any opinions expressed herein are solely those of the authors, and do not in any way represent the views or opinions of any other person or entity.


: Showing Some Signs of Emerging Strength")
