The past 5 years has been rough for commodity bulls in the “grains” industry.
It’s also been rough on farmers. Yields have been good but prices not so good.
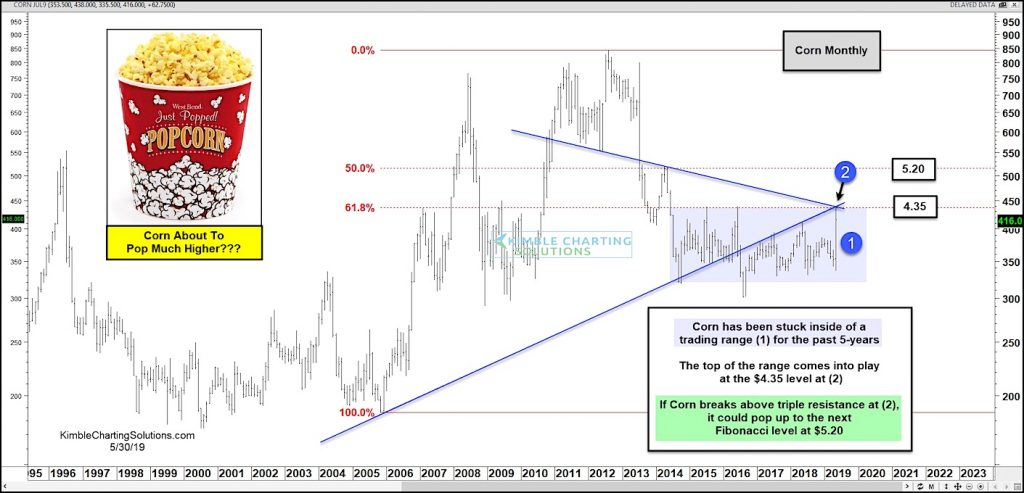
Today we look at corn, as the price per bushel seems to be nearing an important juncture.
The chart below is a long-term “monthly” chart. You can see that corn prices have traded in a one dollar range for nearly 5 years (1).
But there appears to be a glimmer of hope here for Corn bulls. The price of corn is moving higher and testing the top of the range around $4.35 at (2).
It won’t be easy to overcome this resistance level – it represents an important Fibonacci level and the price point is met by a converging overhead trend line.
This is an important juncture for corn bulls. A breakout over resistance at $4.35 should see corn “pop” up to the next Fibonacci level at $5.20. Stay tuned!
Corn “Monthly” Chart
Note that KimbleCharting is offering a 2 week Free trial to See It Market readers. Just send me an email to services@kimblechartingsolutions.com for details to get set up.
Twitter: @KimbleCharting
Any opinions expressed herein are solely those of the author, and do not in any way represent the views or opinions of any other person or entity.

: Worrisome to Broader Market?")

