U.S. – China Phase ONE trade agreement falls short for corn producers:
If last week was all about the USDA’s release of its January WASDE, Crop Production, and Grain Stocks reports, this week was entirely about the signing of the U.S. – China “Phase 1” trade agreement.
The grain markets were hoping the “details” of the deal, which were to be released upon its signing on January 15, would better define just how China would meet its purported obligation to buy an additional $32 billion in U.S. agricultural goods over the next two years.
However, instead what the market received was largely what it already knew.
The got a relatively generic dollar amount equating to an additional $12.5 billion in China – U.S. agricultural purchases over the 2017 “baseline” total of $24 billion for 2020.
Followed by an additional $19.5 billion in China – U.S. agricultural purchases over the 2017 “baseline” for 2021. This however was not knew news.
That said disappointment quickly ensued when China acknowledged that “market conditions” would also influence the timing and size of future U.S. agricultural purchases. Furthermore current Chinese tariffs on specific U.S. agricultural goods would remain in place. Therefore on the surface it would appear the “phase one” trade deal was more “good faith” agreement versus an actual tangible, visible road map to executing the additional $32 billion in purchases over the next two years.
Was there anything I did like in the deal for U.S. corn/ethanol/soybean producers?
Yes, if the agreement did accomplish one important task, which could provide dividends longer-term (i.e. future Phase 2 agreement), it specifically identified how China has in the past leveraged its use of phytosanitary measures, TRQs (tariff rate quotas), as well as, what I would call conveniently timed rejections of U.S. corn containing certain genetically modified traits (i.e. Syngenta’s Agrisure Viptera/MIR 162 in 2014) to block U.S. agricultural imports. In almost every case the measures were taken as a disguised means to protect China’s local domestic cash market from the influx of more competitively priced U.S. feedstock alternatives.
Furthermore one of the feeds addressed in the Phase 1 agreement was U.S. DDGS. In 2016 China started issuing excessive anti-dumping tariffs on U.S. DDGS, which eventually reduced Chinese import demand of the key ethanol, feed co-product to essentially zero. Not coincidently the high-water mark for total U.S. DDGS exports of 12.7 MMT occurred the year prior in 2015 and since then have yet to exceed 12.0 MMT.
That said, while China has yet to lower its current anti-dumping tariffs on U.S. DDGS (ranging from 42.2% to 53.7%) Wednesday’s agreement did go to great lengths to re-open China’s market to future U.S. DDGS imports should China relax its tariffs moving forward and/or issue a percentage of U.S. DDGS available for import tariff-free.
FINAL THOUGHTS ON PHASE ONE:
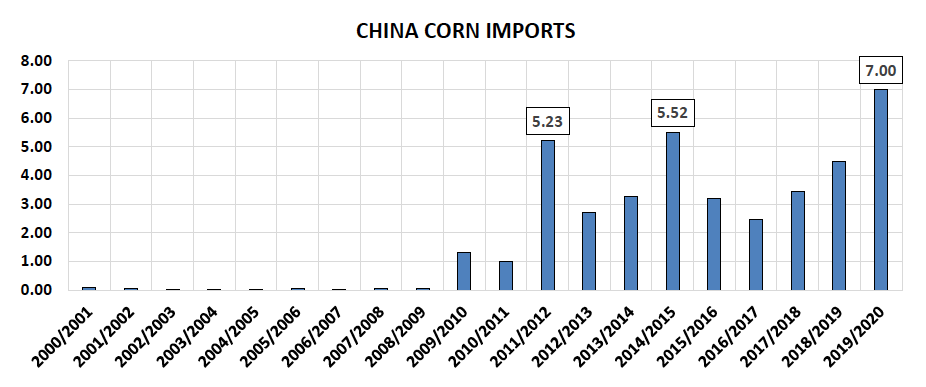
On Friday, corn futures rallied aggressively on the “rumor” China may have booked 2-4 cargoes of U.S. corn off the PNW for spot shipment. Do I believe this is the start of a new and sustainable corn buying campaign from the Chinese of U.S. corn as a result of the Phase 1 trade deal? No…lest we forget just over a week ago China’s vice agriculture and rural affairs minister said China would not increase its global import tariff quota for corn in 2020 (remaining static at 7.2 MMT, nearly identical to the USDA’s current 2019/20 China corn import forecast of 7 MMT). Therefore tariffs on imports below the quota can be as low as 1%, while tariffs on additional imports above the quota can be as high as 65%.
That said, I’m going to assume Friday’s China-U.S. corn buy was likely orchestrated pre-Phase 1 (providing good optics) and will eventually prove to be the exception rather than the rule moving forward. This isn’t to say we couldn’t see China step in and buy small quantities of U.S. corn over the next 2 to 3 weeks however the TRQ has already been established for 2020.
Furthermore, Ukraine is also sure to make up a percentage of China’s 7.2 MMT tariff quota, which invariably will limit the U.S.’s immediate corn export opportunity. Keep mind…market conditions/price still matters. Furthermore China is the second largest corn producer in the world and has to protect domestic cash corn prices to preserves its rural economy. Blocking U.S. corn exports above a certain level will still be a major priority.
CORN FUTURES TRADING OUTLOOK – Week of January 20, 2020
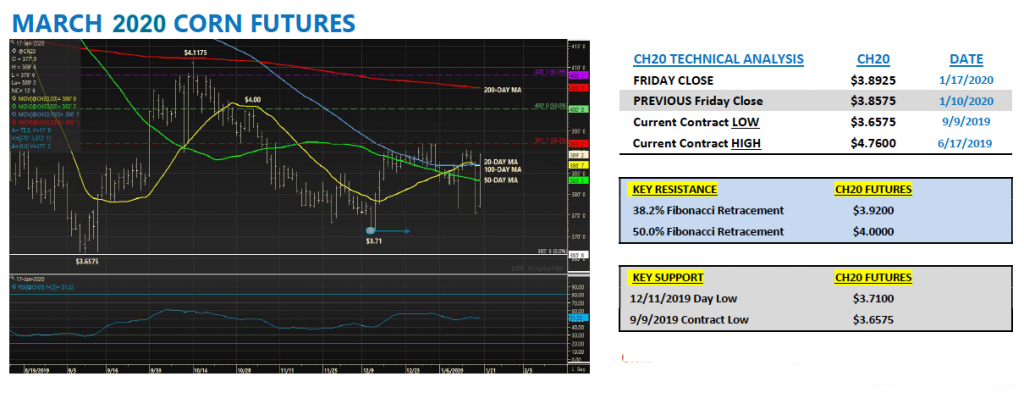
March corn futures rallied on Friday due to the aforementioned rumors surrounding potential China-U.S. corn purchases.
Friday’s price move was enough to lift CH20 to a higher weekly close by 3 ½-cents per bushel. That said technically March corn still remains very much range bound with $3.92 providing strong topside resistance.
Will Friday’s price strength carry over into next week?
I remain the contrarian regarding March corn’s ability to rally above $3.95 in the near-term for a variety of reasons. For one, U.S. corn export business in general continues to disappoint with the window closing for the U.S. to take advantage of Brazil’s limited export presence prior to its first corn harvest in February.
Thursday’s weekly export sales report showed U.S. corn export commitments for 2019/20 still 40% behind a year ago or -511 million bushels. Even after including the USDA’s revised 2019/20 U.S. corn export forecast in the January WASDE report of 1.775 billion bushels (lowest total since 2012/13), the current sales pace still suggests that figure is too high.
And secondarily, this week’s EIA stats for ethanol confirmed that the industry is essentially running wide open again, which has already pressured industry “average” spot ethanol margins now back down well below cash EBITDA. The most recent EIA report showed weekly U.S. ethanol production of 1.095 million b/d (4th highest ever) followed by a surge in U.S. ethanol stocks back over 23.0 million barrels for the first time since September 27th, 2019. Ethanol values have once again turned defensive as a result.
Therefore, due to a continued lack of U.S corn demand coupled with expectations for an additional 4.5 to 4.8 million U.S. corn acres in 2020…I currently don’t see any reason to chase fresh corn longs at or near key price resistance.
Twitter: @MarcusLudtke
Author hedges corn futures and may have a position at the time of publication. Any opinions expressed herein are solely those of the author, and do not in any way represent the views or opinions of any other person or entity.

: Worrisome to Broader Market?")
