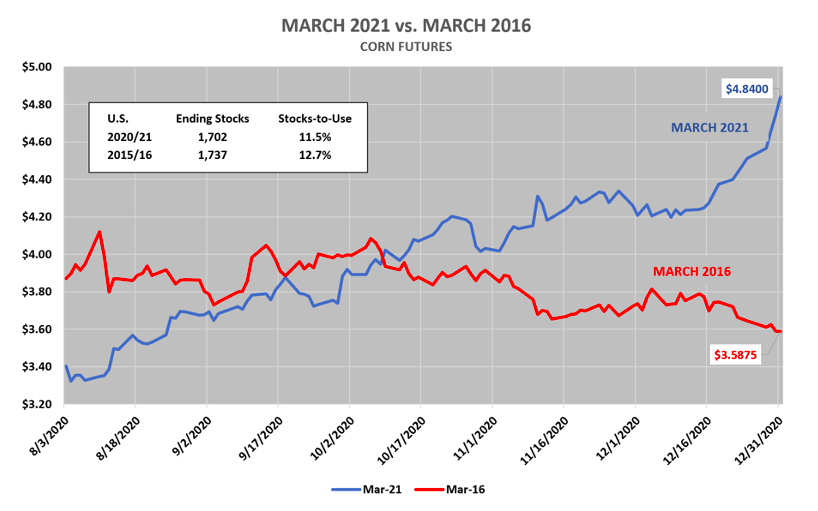
To say the corn market ended 2020 on a “high note” would be a gross understatement considering March 2021 corn futures traded up to a new contract high of $4.85 ¾ on the final trading day of the year.
This is the highest March corn futures have traded during this timeframe since December 2012, which at that time was a market pricing in (per the December 2012 WASDE report) a 2012/13 U.S. corn yield of 122.3 bpa (the lowest national yield since 1995/96), pipeline U.S. corn ending stocks of 647 million bushels, and a stocks-to-use ratio of only 5.6%.
By comparison, the December 2020 WASDE report put the USDA’s latest projections had the 2020/21 U.S. corn yield at 175.8 bpa (the 3rd highest all-time), U.S. corn ending stocks at 1.702 billion bushels, and a stocks-to-use ratio of 11.5%. These numbers are all sizably different from the market mix that fueled a much more predictable run in March corn futures from December 2012 through March 2013 above $7.00 per bushel.
That said, if we primarily focus on the current U.S. corn ending stocks estimate of 1.702 billion bushels and stocks-to-use ratio of 11.5% for 2020/21, the most recent analog comparison is 2015/16’s ending stocks figure of 1.737 billion bushels and stocks-to-use ratio of 12.7%. So where did March 2016 corn futures close on December 31, 2015? $3.58 ¾.
That’s not a misprint…$1.27 per bushel BELOW Thursday’s, 12/31 close of $4.85 ¾. The premium disparity apparently accounting for 2020/21 U.S. corn ending stocks being down 35 million bushels versus 2015/16 (sarcasm noted).
Therefore what is really driving the current rally in corn futures back to historic highs? I would argue a lot money and a heavy dose of creative corn storytelling aimed at maximizing the “fear and what-if’ game.
THE MONEY & THE MEDIA INFLUENCE
Money managers have become the driving force in agricultural commodities. The combination of more money and more market “analysis” has turned what was 5-years ago a minor storyline into a well-orchestrated (and financed) fear pandemic, coalescing into a tsunami of “analyst” driven exaggerated S&D outcomes.
The most recent being the announcement that Argentina was suspending additional corn exports until March 1st. Was this a legitimate reason for March corn futures to have rallied another 45 ¾-cents per bushel in the past 7-trading sessions; with March corn futures already trading at approximately $4.40 per bushel on December 21st?
I would argue “no” considering Argentina historically doesn’t export significant volumes of corn during January and February as it is. The majority of Argentina’s crop year corn exports (estimated at 34 MMT or 1,340 million bushels for 2020/21) occur during March through September, which coincides with the timing of Argentina’s corn harvest in March. That part of the story conveniently gets left out when assessing just how bullish this story was and is moving forward.
This same choregraphed, bullish “news” cycle has pushed essentially one-sided storylines for the past 5-months including China-U.S. corn purchases translating to record U.S. corn export sales, Brazil’s corn crop moving lower, as well as, a “derecho” in Iowa leveling corn and soybean crops back on August 10th. And while there are shades of truth regarding every one of those market drivers being price supportive, the reality is U.S. corn ending stocks of 1.702 billion bushels remain more than adequate and far removed from levels warranting immediate price rationing. Furthermore, the fact that the U.S. ethanol industry (which accounts for 37% of total U.S. corn demand; approximately double U.S. corn exports) continues to experience significant margin pressure due to U.S. gasoline demand running 13% below a year ago largely goes unnoticed. Why? It doesn’t fit the narrative.
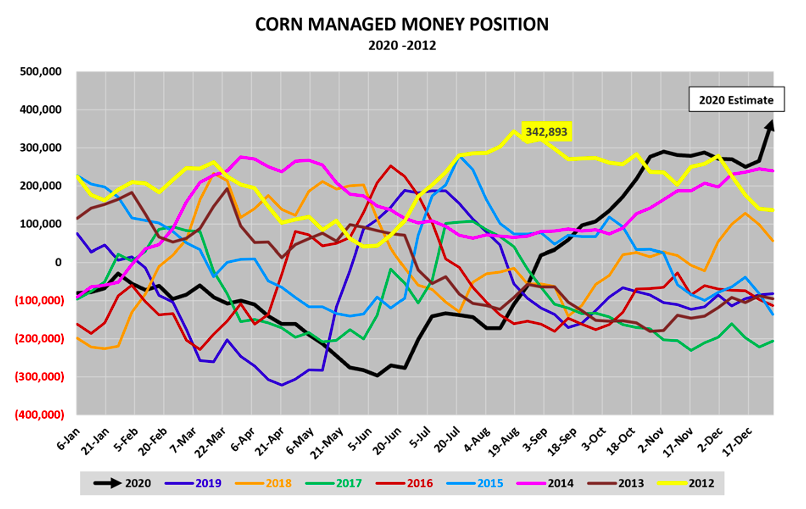
Enter “the money machine” which has been aided and abetted by a 32-month low in the Dollar Index. As of the latest Commitment of Traders report (December 21st, 2020) the Managed Money long in corn was +265,713 contracts.
However, after factoring in the near 46-cents per bushel rally in March corn futures since that report, private analysts are now forecasting a Managed Money long approaching +370,000 contracts. To put that figure in perspective, if that estimate proves even remotely accurate, Money Managers are now carrying a net long exceeding the maximize position length they held in 2012 (+342,893).
That position was achieved in August and coincided with a record high of $8.46 ¼ per bushel in March corn futures on August 10th, 2012. 2012 was the “100-Year Drought” featuring at times the 2nd lowest U.S. corn stocks-to-use ratio projection ever. And yet by end of December 2012, the Money Mangers had reduced their net long to less than +150,000 corn contracts. Let that sink in before you allow “analysts” to try and convince you that the actual 2020 U.S. and global corn S&D supports the Money’s current position length.
MONEY FLOWS…IN & OUT
The CME needs “money” actively participating in its commodity markets. Furthermore they continue to facilitate ways to expand federal position limits for a number of futures contracts including corn, as well as, increase what’s referred to as an “enumerated bona fide hedge” exemption. This effectively allows market participants to hold a position exceeding a federal position limit without receiving prior approval from the CFTC.
In layman’s terms (regardless of how the CME tries to spin it), they’re turning the CME into a casino. They’re making it much easier for more and more “money” to enter the marketplace while simultaneously making it virtually impossible for a small hedger to utilize the exchange to offset and manage risk. The final blow comes when the CME unilaterally chooses to raise margin requirements (as they have just done in soybeans), which further intensifies the available capital crunch on small hedgers. The “money” escapes unscathed via a bigger bank account and can in turn use the CME’s margin increase to create a chain reaction of small hedger buy-backs. This proves disastrous for small hedgers as short hedges are lifted at the absolute worst time, during what is typically the exhaustive phase of a major up move. We all know how the movie ends… corn futures eventually roll over, after appearing bullet-proof for months on end and a post-mortem is conducted on all small hedgers who liquidated their positions at what proved to be the market “highs.” This is the new-normal corn market as we head into 2021…
CAN CORN CONTINUE TO RALLY?
Yes. The “money” can ultimately take corn as high as it wants to irrespective of the U.S. and global corn S&D. Invariably the strength in the soybean complex, which I would argue is supported by a real need to ration 2020/21 U.S. soybean supplies, is also factoring into the rally in corn futures. However my overriding opinion is… this rally in corn is more paper than substance. And these same “analysts” attempting to defend the current rally in corn based on purportedly data driven analytics including comparative World corn export offers, dry weather in Argentina and Brazil, and/or China’s diminishing state grain reserves will flip the script immediately after corn futures eventually rollover. And that backdraft could be equal parts painful for small hedgers who abandon their marketing strategies with March 2021 corn futures at new contract highs.
Twitter: @MarcusLudtke
Author hedges corn futures and may have a position at the time of publication. Any opinions expressed herein are solely those of the author, and do not in any way represent the views or opinions of any other person or entity.

: Worrisome to Broader Market?")
