Cisco … an amazing company with amazing technology! Unlike most of my posts where I have no earthly idea of the fundamentals involved in the daily running of the company, I do have a clue of the importance and powerful technology that they bring to the table. All that being said, it’s still just a chart.
Folks, there is so much AMAZING stuff going on with the chart of Cisco Systems (CSCO). But, let’s keep it simple. So, a couple of things:
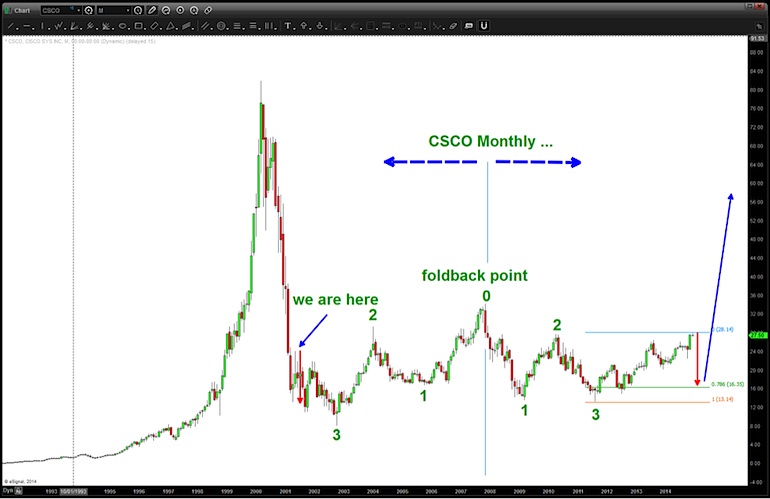
- Mirror Imaged Foldbacks: the concept is the chart comes into a point and then goes out of the point in the opposite direction. The price doesn’t have to be exactly the same, sometimes it is like the mirror image foldback on Silver prices (OBTW that was my first post for SIM. Thanks Andy!). The mirror image foldbacks occur on any time frame but they are most powerful on longer term charts. And, if they are going to fail, they usually fail at the pivot points. The chart below is a long-term MONTHLY look at CSCO and the mirror image holdback. And, yep, we’re at an important point.
- Note that a case will be made, a little later, that we are the point “we are here” and should be prepared for weakness that should be BOUGHT to foldback UP the crash that occurred in 2000. See the foldback point?
Cisco Systems Monthly Stock Chart – Long-term Mirror Image Foldback?
So, where are we now? A case can be made that we have completed 5 waves up and, based on the foldback thesis, this is simply 1 of 5 big waves higher that will ultimately rock n roll CSCO up in the future. Weekly chart below:
Cisco Systems (CSCO) Weekly Stock Chart
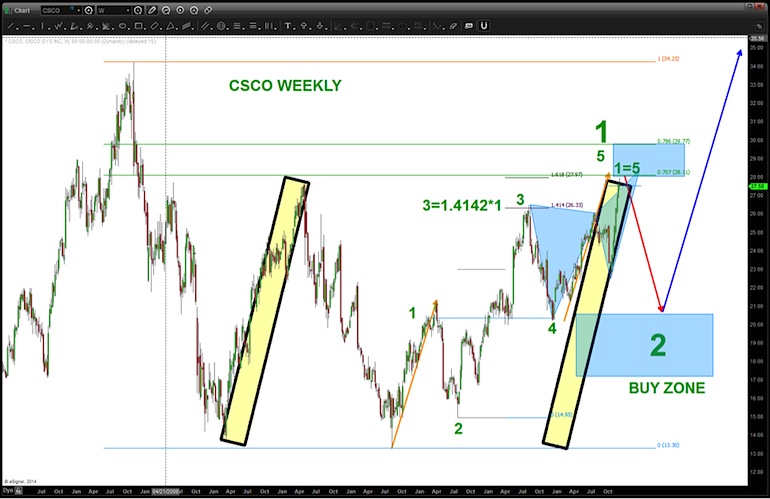
Above you can see:
- We have rallied the same amount shown by the yellow rectangles.
- We have completed a 5 wave sequence up that does not violate any “Elliott” rules
- We can already see an expected support zone.
So, the overall thesis is that we are completing a “we are here” portion of the foldback and we should expect Cisco’s stock to come down and then buy it to take part in a very powerful bull run.
One last thing… sure looks like institutional accumulation over the past 12 years.
Will we get that final pullback in CSCO shares? This pattern implies that it could happen. As I always say, a pattern is just a pattern. Thanks for reading.
Follow Bart on Twitter: @BartsCharts
No position in any of the mentioned securities at the time of publication. Any opinions expressed herein are solely those of the author, and do not in any way represent the views or opinions of any other person or entity.


 and Russell 2000 (IWM)")


