When beginning to analyze any market and/or security it is recommended one look at the longest time frame possible. The longer-term moves tend to repeat in time or price or both, while giving you a flavor for the potential moves that might be forthcoming.
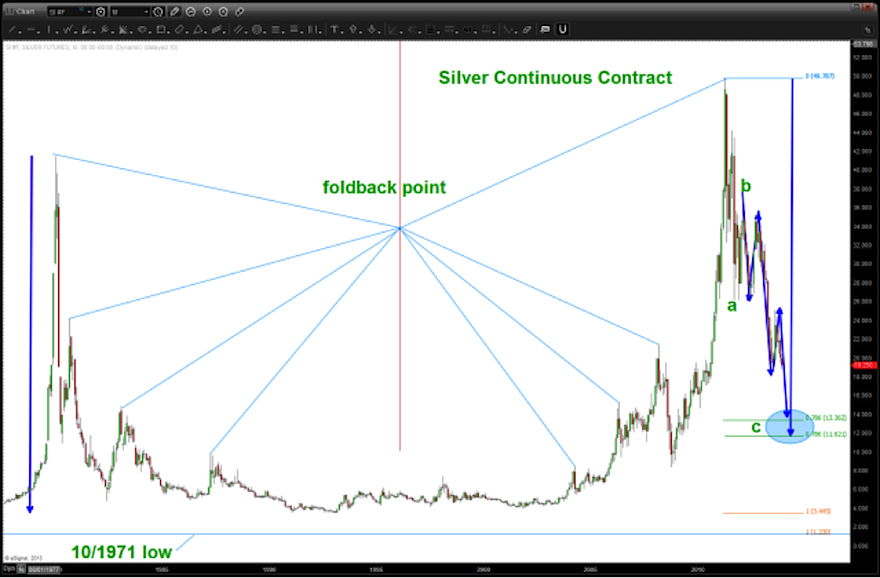
As well, longer-term moves often repeat the same form and proportion. In the case of Silver, a perfect mirror image fold back is in the process of taking place.
When looking for mirror image fold back potentials, I look for a single point that basically allows the price to move IN and AWAY from this point in the same form.
To demonstrate this, I’d like to show a series of charts highlighting each of Silver’s price moves over the past 6 years. These charts are snapshots of the price of Silver futures and spot prices. At the end, I will use this patterning to attempt to provide a logical point to be long silver in the most risk-averse manner possible.
October 2008
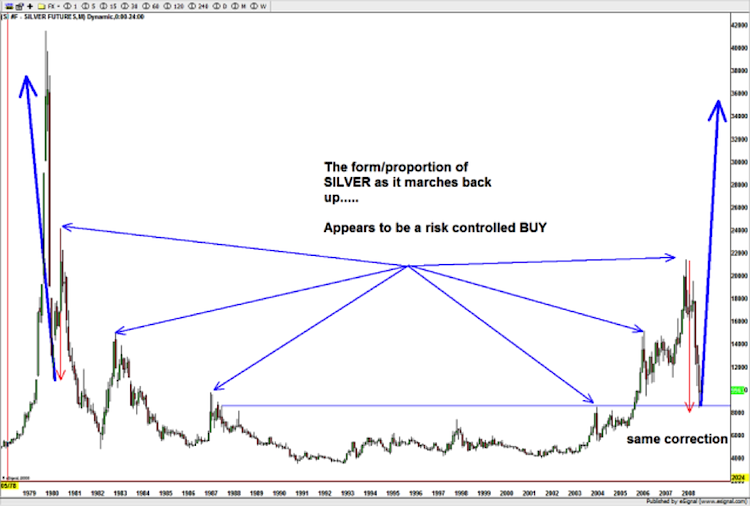
The chart above shows the center point of the mirror image fold back from 1993. As you can see, three distinct tops on the way down and on the way up are formed (shown by blue arrows) and, the “exact” same corrective move (red arrow) is being completed. This was a great time to buy Silver. Why? Because the mirror image fold back UP in price (dark blue arrows) suggested a move of this magnitude was evident.
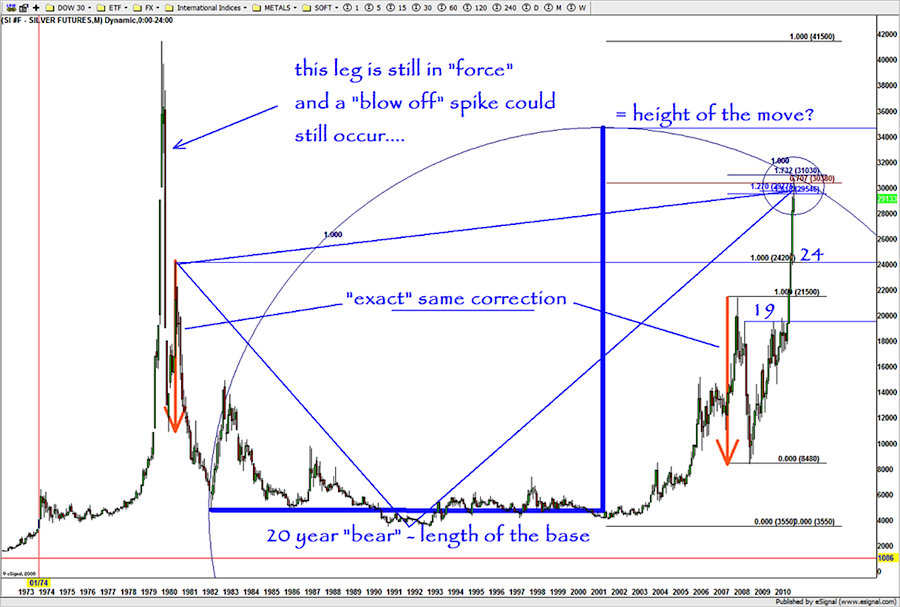
December 2010
At the time, I gave a heads up about nearing overhead resistance but added that this leg is still in force and a “blow off” spike could still occur. Just because we have a very nice PATTERN that is working doesn’t mean it can’t fail, anytime.
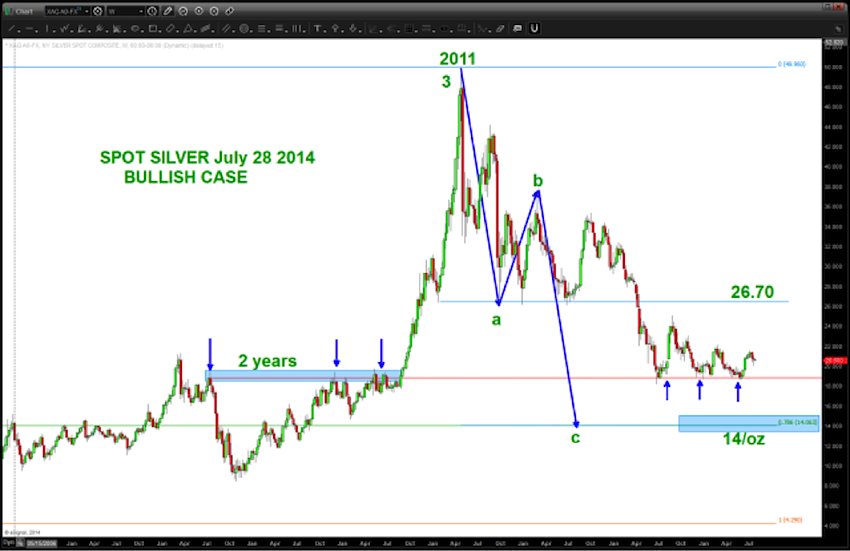
May 2011
Note, the dark blue legs DOWN and UP (exactly) completed and it was at this time where buyers should get out and the opportunity to short Silver was coming into view.
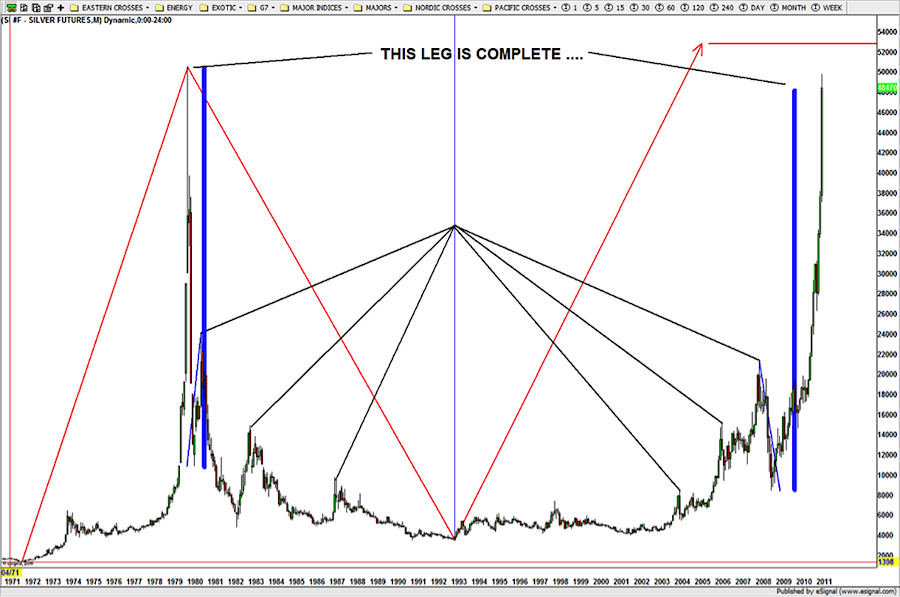
The next chart highlights some of the other “math” associated with this move that gave additional credence that the move in Silver was, POTENTIALLY, finished.
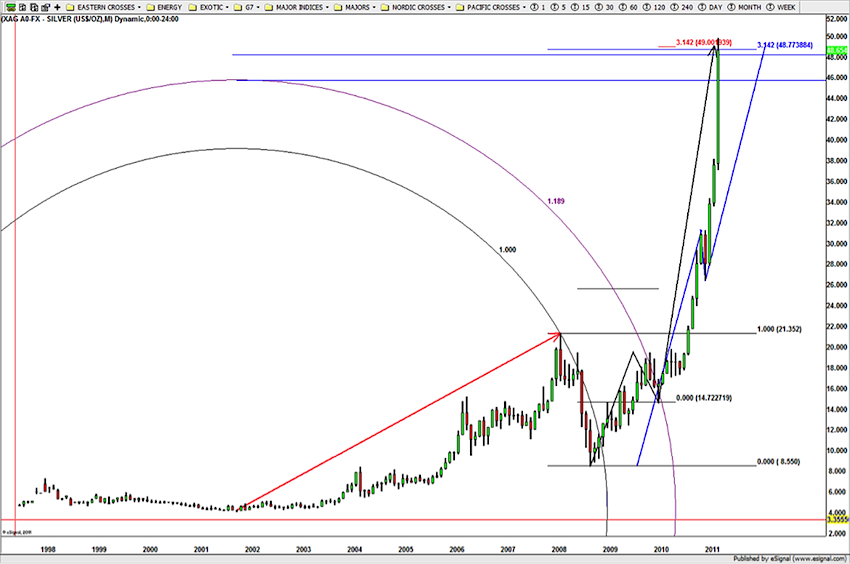
At this point, the associated 3 wave corrective move was to be expected and, as we shall show in additional charts below, the “Silver Script” is working out quite nicely.
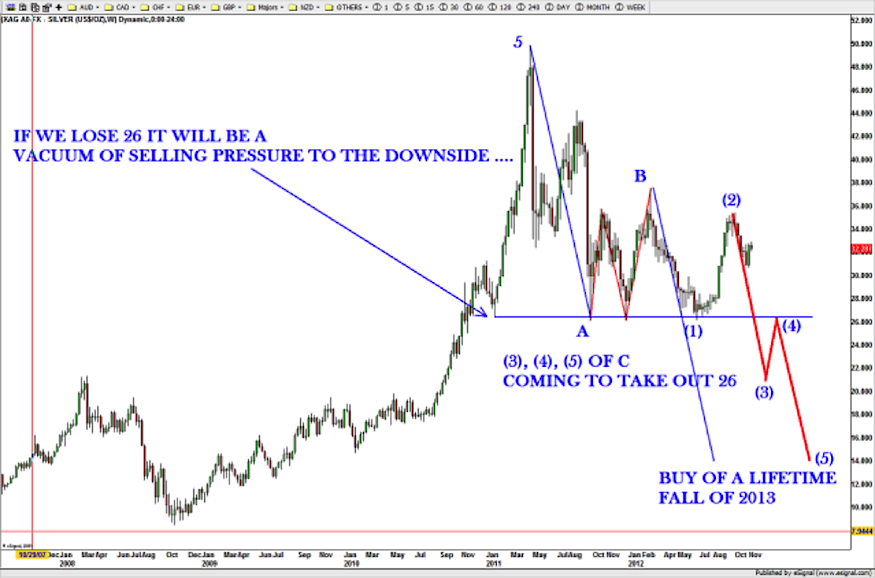
November 2012
As the correction in Silver prices is ongoing, a tremendous amount of “emotion” needed to be drained and the expectation for a deep and rather long correction was expected. Why? Well, if you go back to the mirror image fold back chart – that’s what it did on the way up.
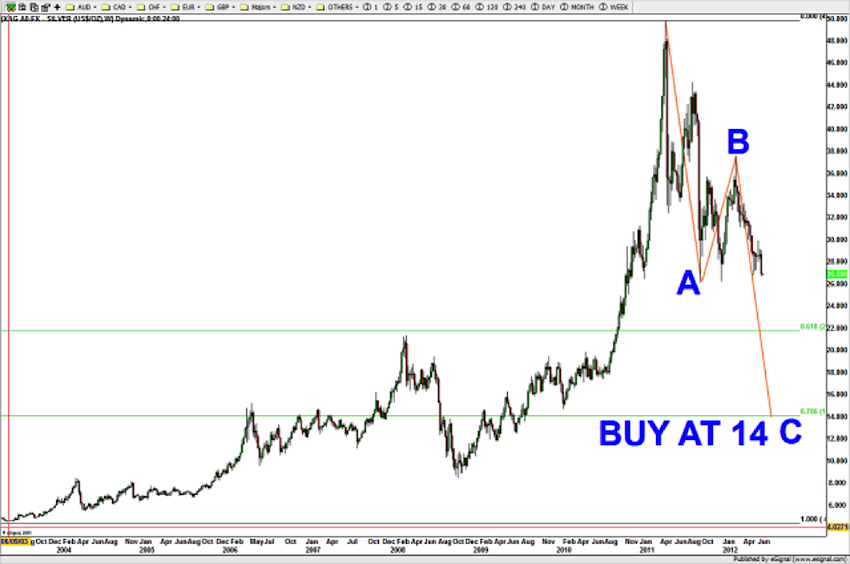
Below are some of the real time charts I posted. Yes, I am using Elliott Wave. For me, Elliott wave is a powerful tool to use with corrections. On longer-term charts, the PATTERNS are much easier to see and eliminate quite a bit of noise in trying to “count” every squiggle. So far, the correction has been very predictable and played nicely to the Elliott Wave corrective tune.
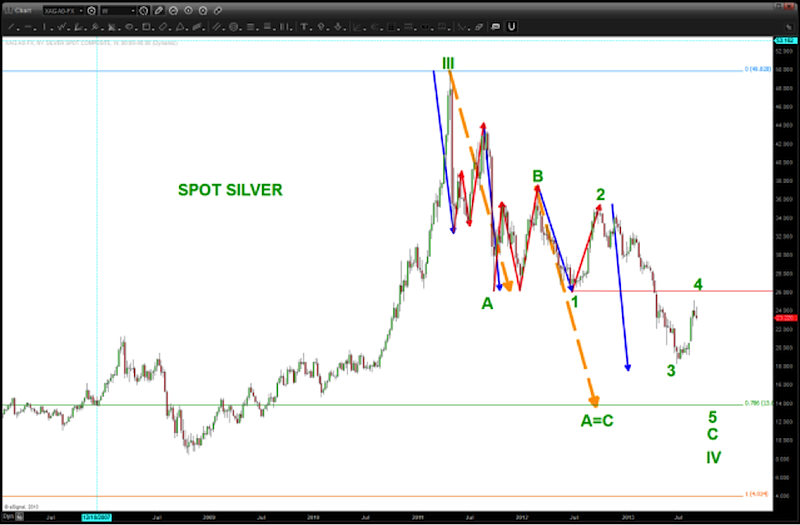
December 2013
At this point, the correction had gone a little longer than anticipated (for me) however the form is still in line with a “normal” correction. Therefore, another look at the parabolic move up into the high of January 1980 was needed.
Note, the $14 area is still the target but $11 has emerged as distant possibility.
Again, the count is made of the corrective move ongoing. Note, that a=c, (1) = (5) all at the KEY $14 area.
April 2014
The triangle continued to take shape, tightening with each month.
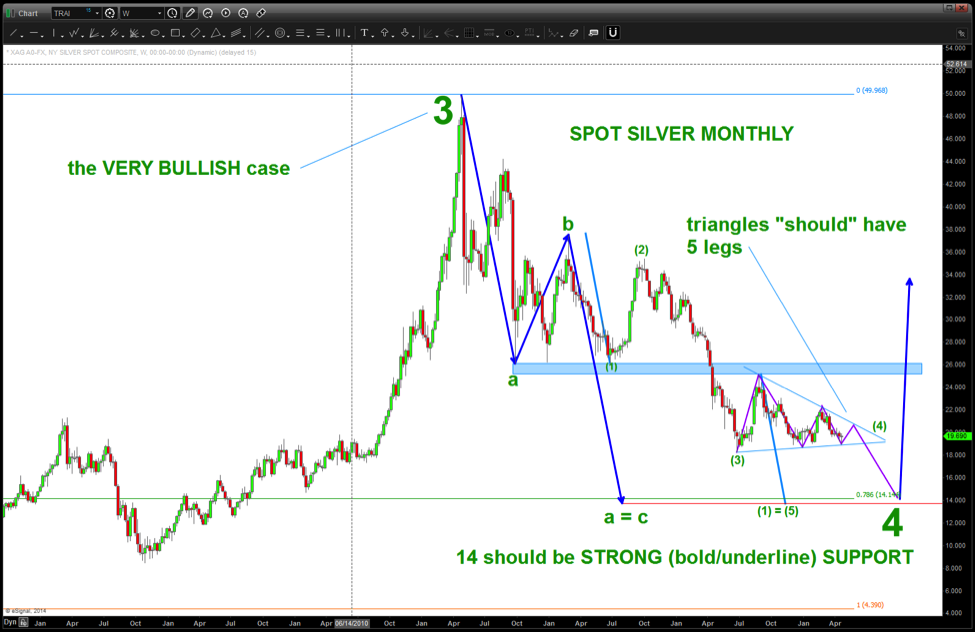
July 2014
The key $19-$20 level has held for almost a year and half… below is an analysis of this level as RESISTANCE and now SUPPORT (the polarity principle).
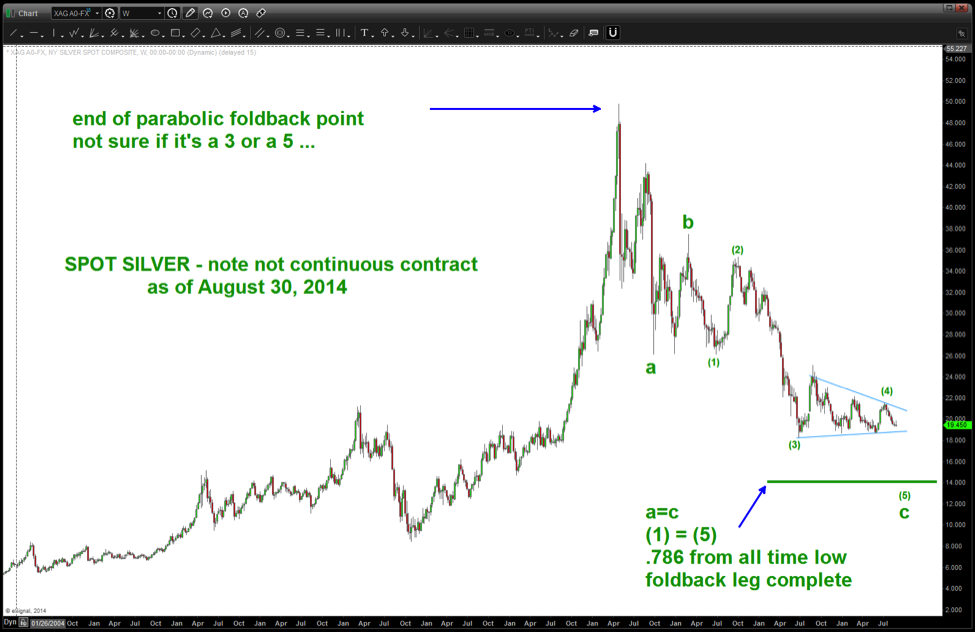
Current – as of August 30, 2014
There is nothing that is keeping the analysis from moving away from the $14/oz level on Silver being the MAJOR target. Below is an updated chart for Silver. The ONLY thing that is still a question mark is whether the 2011 high in Silver was a wave 3 or a wave 5. This will only reveal itself over time.
All that being said, the target to go long silver still remains $14.
No position in any of the mentioned securities at the time of publication. Any opinions expressed herein are solely those of the author, and do not in any way represent the views or opinions of any other person or entity.


